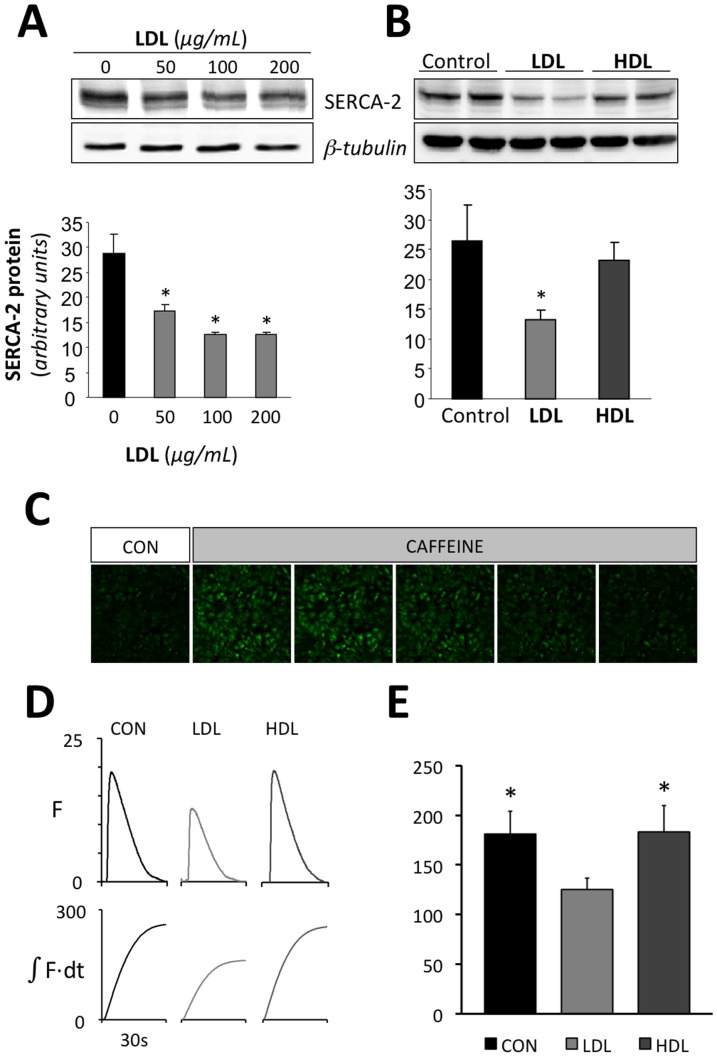
Figure 4. LDL reduces SERCA expression and SR calcium loading.
Representative Western blot analysis showing SERCA2 bands in HL-1 cells exposed to increasing LDL concentrations (0, 50, 100 and 200 µg/mL) (A) or to similar dose (500 µg/ml) of LDL or HDL (B) for 24 hours. The bar graph below shows SERCA2 band quantification. Unchanged levels of β-tubulin are shown as loading control. Results are mean±SEM of three independent experiments performed in duplicate. *P<0.05 versus. HL-1 cells incubated in absence of LDL. C Calcium images acquired at rest before (CON) and during a rapid caffeine application. D Representative calcium transients recorded in cultures incubated without lipoproteins (CON), with 500 µg/ml LDL or with 500 µg/ml HDL. The lower panel shows the corresponding time integrals of the calcium transients. E summary of the effect of LDL and HDL on the time integral of the caffeine induced calcium transient. *P<0.05 vs. cells incubated with LDL

