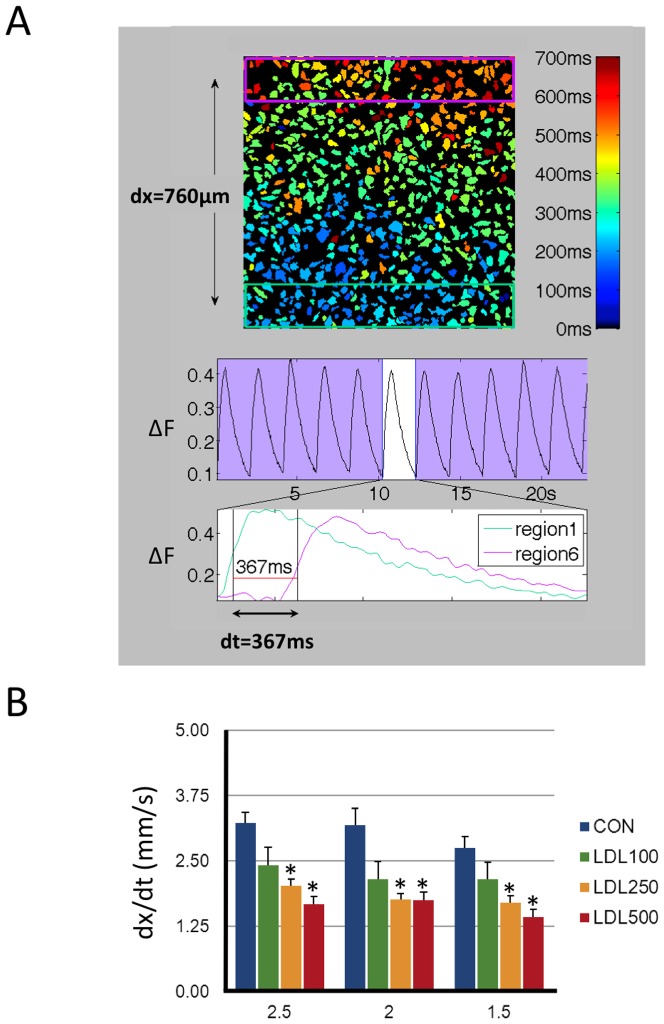
Figure 7. LDL slows the propagation velocity of the Ca2+ - transient.
A HL-1 image field with the activation time for individual myocytes shown in color code. Green and pink rectangles at the bottom and the top of the images indicate regions used to measure calcium transients proximal and distal to the stimulation electrodes respectively. Image field is 1×1 mm. The middle panel shows global calcium transients and the lower panes shows local calcium transients recorded in green and pink rectangles. The propagation velocity (dx/dt) was calculated as distance between the two rectangles divided by the time elapsed between the green and pink calcium transients at their half maximum (dt, indicated below traces). B Effect of 0 (Control), 100, 250, and 500 µg/ml LDL on the propagation velocity (dx/dt) recorded at stimulation intervals of 2.5, 2, and 1.5 s. Values were recorded in four different fields from each of five HL-1 preparations. Values statistically different from the corresponding Control value are indicated with asterisks.

