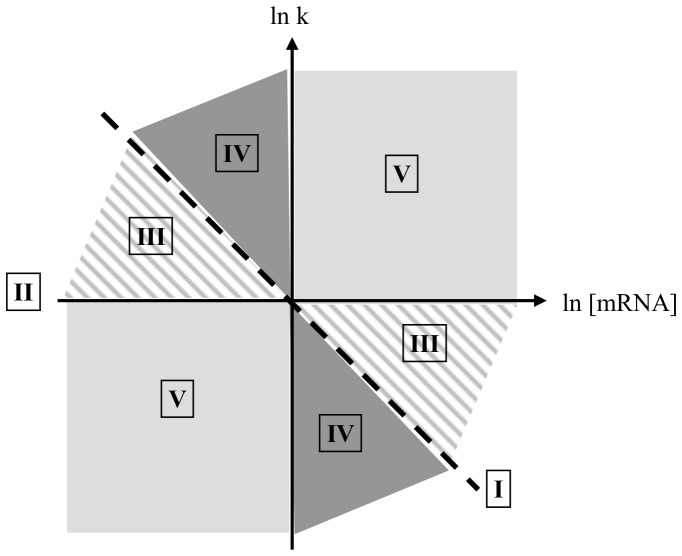
Figure 4. Graphical representation of the different modes of gene expression control.
This plot of lnk versus ln[mRNA] represents, for each mRNA, the modulations of these parameters between two conditions (i.e. different growth rates). The opposite slope of this plot corresponds to the degradational regulation coefficient ρD. Control solely by degradation is represented by the dotted line (I), control solely by transcription is associated to the x-axis (II). Slopes grouped in the hatched, dark gray and light gray areas reveal respectively shared (III), mainly degradation-related (IV) and mainly transcription-related (V) control.

