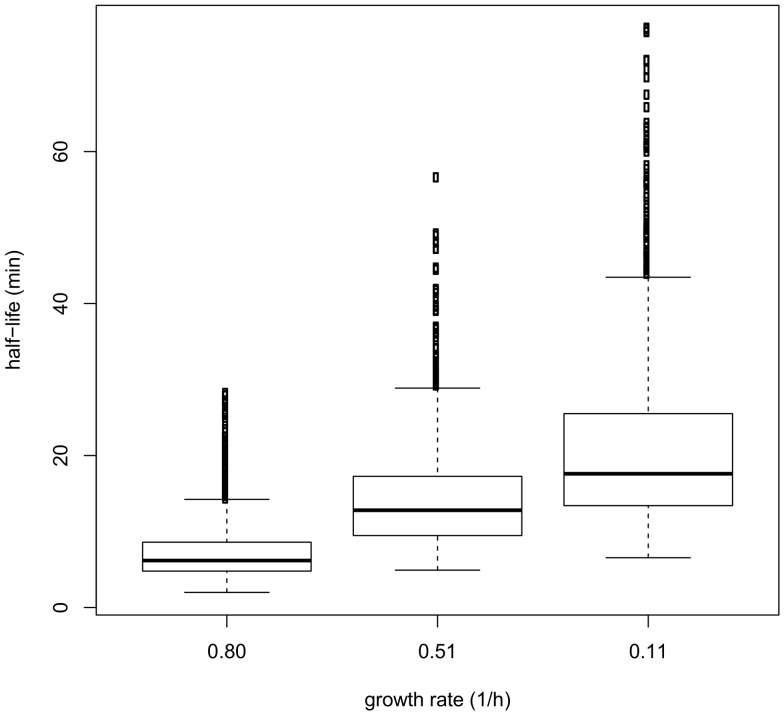
Figure 5. Box plot representation of mRNA half-life distribution during the progressive adaptation to isoleucine starvation (batch).
This box plot represents the half-life values in four quartiles separated by horizontal bars. The central bar (in the middle of the rectangle) represents the median value.

