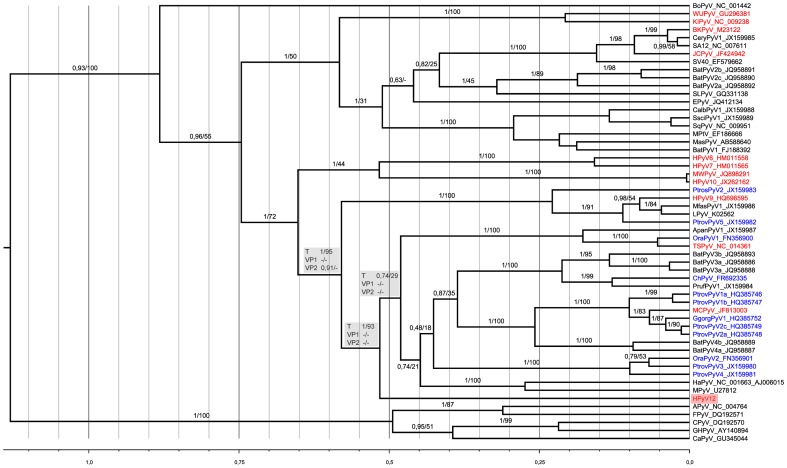
Figure 2. Phylogenetic analysis of HPyV12.
A Bayesian chronogram was deduced from the analysis of a 488 amino acid alignment of LTAg sequences. Polyomaviruses identified from human hosts are in red, from apes in blue. The human polyomaviruses MXPyV and the US strain of MWPyV have the same phylogenetic position as HPyV10 and are not shown. The sequence of the very recently discovered human STLPyV which is most closely related to HPyV10, MWPyV and MXPyV, became only available at the end of the revision process of this manuscript; it was therefore not included in the datasets put together for the present study. Statistical support for branches is given as posterior probability/bootstrap. For three branches defining potentially meaningful bipartitions (with respect to the question of the phylogenetic placement of HPyV12), statistical support observed for the corresponding bipartitions in the VP2 and VP1 analyses is also shown (grey panels). Hyphen indicates that bipartition was not observed in the ML or Bayesian tree. The scale axis is in amino acid substitution per site. This chronogram was rooted using a relaxed clock. A maximum likelihood analysis of the same dataset concluded to a similar topology and is thus not shown here.

