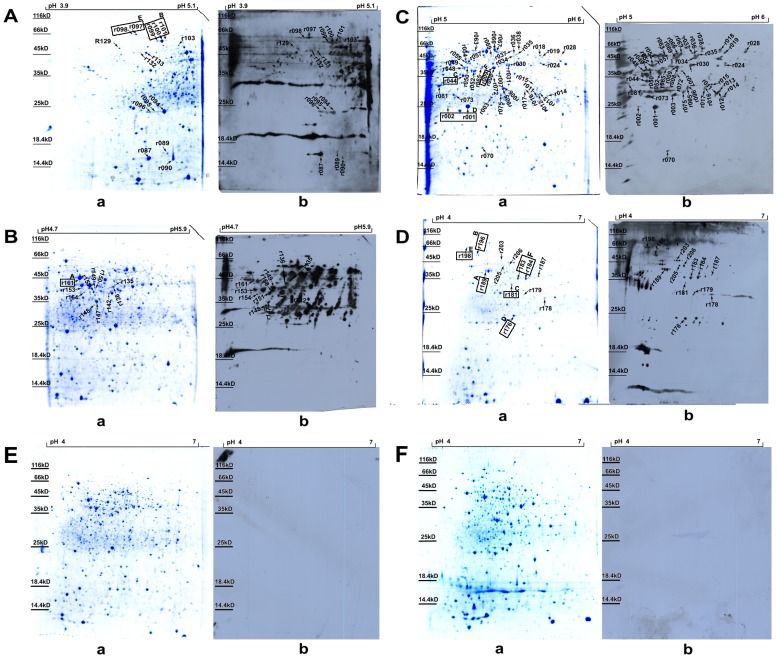
Figure 1. 2-DE map and corresponding western blotting image of B.anthracis A16R vegetative and spore proteins.
(A–C) Vegetative proteins for the pH 3.9–5.1, 4.7–5.9 and 5–6 strips, respectively. (D) Spore proteins for the pH 4–7 strip. (E and F) Vegetative and spore proteins for the pH 4–7 strips, respectively. (a and b) for A–D indicate 2-DE maps and the corresponding western blotting images using rabbit immune sera against B.anthracis live spores, respectively. (a and b) for E and F indicate 2-DE maps and the corresponding western blotting images using rabbit unimmunized sera, respectively. The spots whose names are in boxes indicate that those proteins were identified in both vegetative and spore proteins. The same upper case letter indicates the same protein in the vegetative and spore proteins.

