
Figure 1. Effect of AMDCP on gastric mucosal lesions and inhibition percentage in rats.
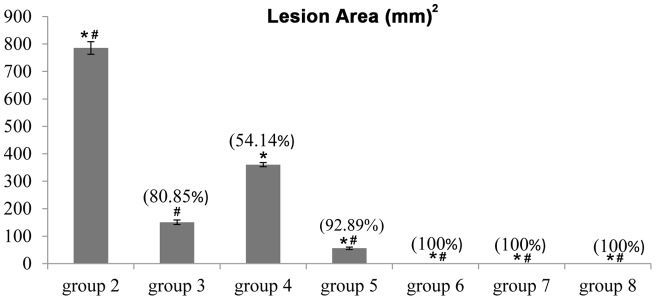
Inhibition of gastric lesions (%) is indicated in brackets above the columns. Groups 2 and 3 represent the ethanol control group and the reference control group, respectively. The experimental groups are presented as groups 4–8. All values are expressed as the means ± standard error of the mean. Mean difference is significant at the p<0.05 level (one-way between groups ANOVA with post-hoc analysis). * significant when compared with the group 2. # significant when compared with the group 3.