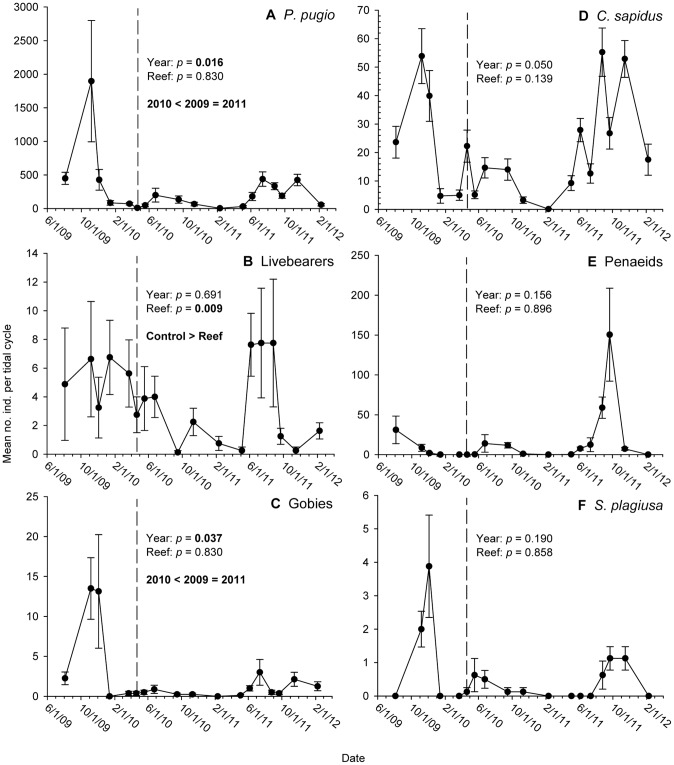
Figure 2. Time-series abundance plots for numerically dominant resident and transient species, 2009–2011.
Mean abundances of (A) Palaemonetes pugio; (B) livebearers; (C) gobies; (D) Callinectes sapidus; (E) penaeid shrimp; and (F) Symphurus plagiusa. Means are derived from eight traps per sample date. Error bars: +1 SE.

