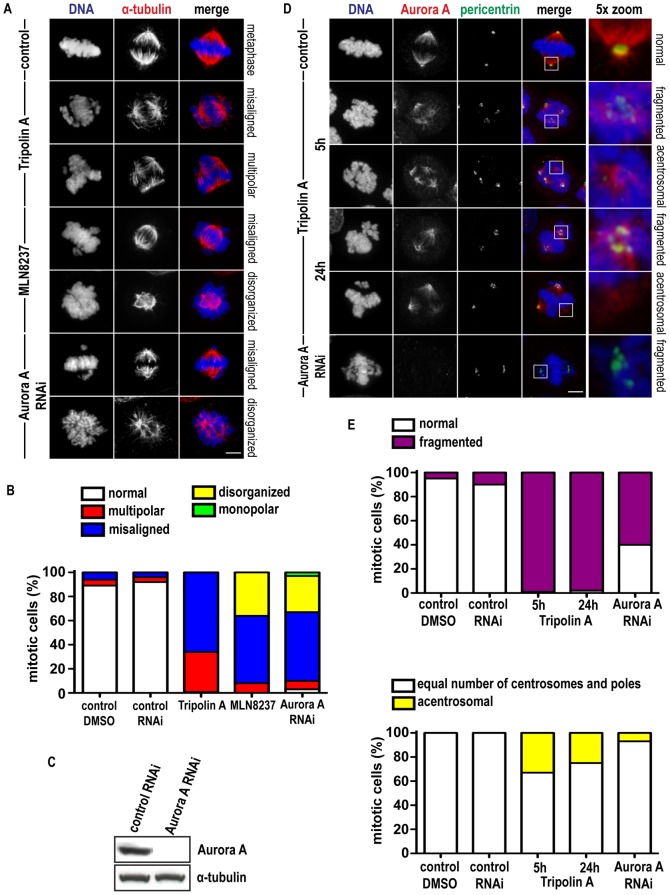
Figure 3. Tripolin A treatment results in spindle and centrosomal defects.
(A) Representative immunofluorescence images of mitotic HeLa cells treated with DMSO, 20 µM Tripolin A for 24 h, 100 nM MLN8237 for 24 h or Aurora A siRNAs. In the merged images α-tubulin is pseudocolored red, DNA blue. (Scale bars, 5 µm). (B) Graph showing the percentage of normal, multipolar, misaligned, disorganized and monopolar figures in control mitotic cells (DMSO or control siRNAs) and mitotic cells treated with Tripolin A, MLN8237 or Aurora A siRNA (n = 300 cells for each group, from three independent experiments). (C) Western Blot analysis for Aurora A levels in Aurora A siRNA treated cells. α-tubulin was used as a loading control. (D) Images of mitotic HeLa cells treated with DMSO, 20 µM Tripolin A for 5 h and 24 h or Aurora A siRNA. In the merged images Aurora A is pseudocolored red, pericentrin green, DNA blue. (Scale bar 5 µm). (E) Graph showing the percentage of mitotic cells with fragmented centrosomes (up), or acentrosomal poles (down) in control mitotic cells (DMSO or control siRNA) and mitotic cells treated with Tripolin A, or Aurora A siRNA (n = 150 cells for each group, from three independent experiments).

