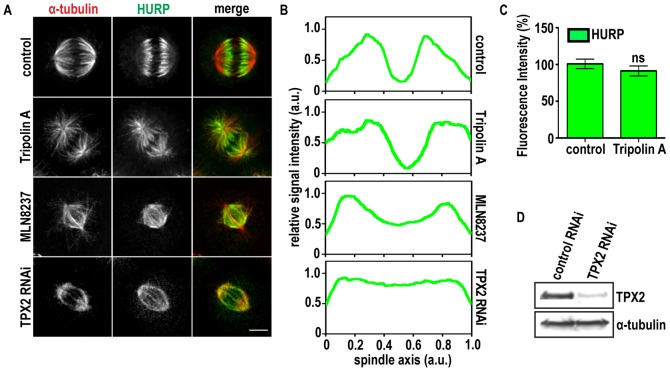
Figure 5. Inhibition of Aurora A alters the localization of HURP.
(A) Representative immunofluorescence images of metaphase cells treated with DMSO, 20 µM Tripolin A or 100 nM MLN8237 for 24 h, or TPX2 siRNAs. In the merged images α-tubulin is pseudocolored red, HURP green. (Scale bars, 5 µm). (B) Longitudinal line scans of HURP intensity from metaphase spindles of control and Tripolin A treated HeLa cells (n = 5 for each group). Intensities were normalized to maximum value within the same spindle, and spindle size was interpolated. Curves indicate mean values. (C) Fluorescence intensity (% percentage) of HURP quantified in control metaphase cells and cells treated with Tripolin A (n≥20 cells for each group, from at least two independent experiments). ns p>0.05; (Mann-Whitney test, two-tailed). Error bars represent SEM. (D) Western Blot analysis for TPX2, in TPX2 siRNAs treated cells. α-tubulin was used as a loading control.

