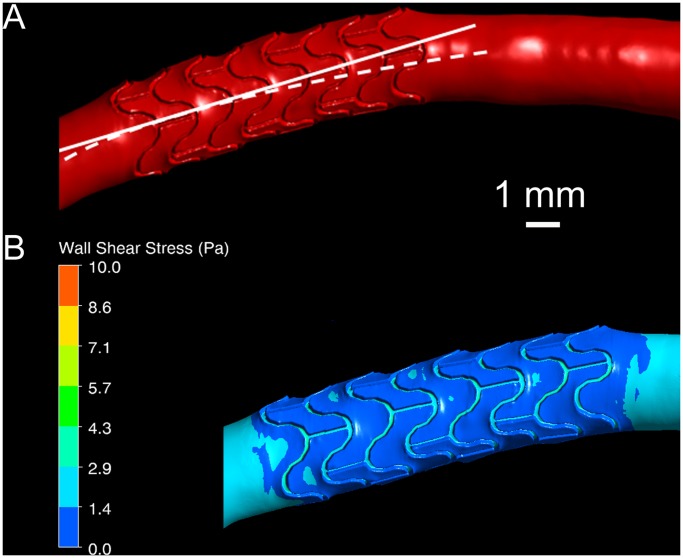
Figure 3. Axial arterial deformation due to stenting.
(A) Visualization of arterial centerline change in a stented section. The solid line shows the axis of the stent, while the dashed line approximates the centerline of the stent-free artery. (B) Wall shear stress (WSS) distribution in the same stented artery. An extended area of low WSS is seen immediately downstream of the stent at the outer artery wall due to the change in curvature.

