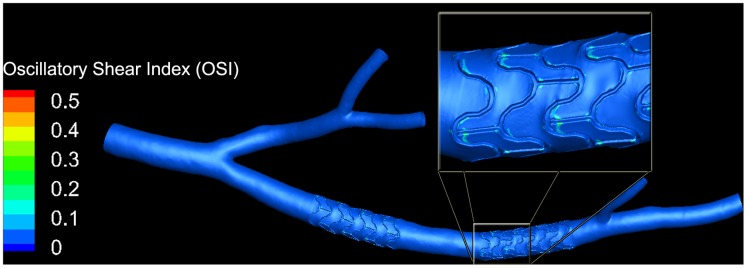
Figure 6. Oscillatory shear index (OSI) distribution in a porcine left coronary artery with two stents.

The inset shows a magnified view of part of the second stented segment. Elevated values of OSI have been reported to correlate with atheroprone vessel regions [17]. Areas of increased OSI are visible near strut junctions. They contain small focal spots that reach values close close to the maximum of 0.5.
