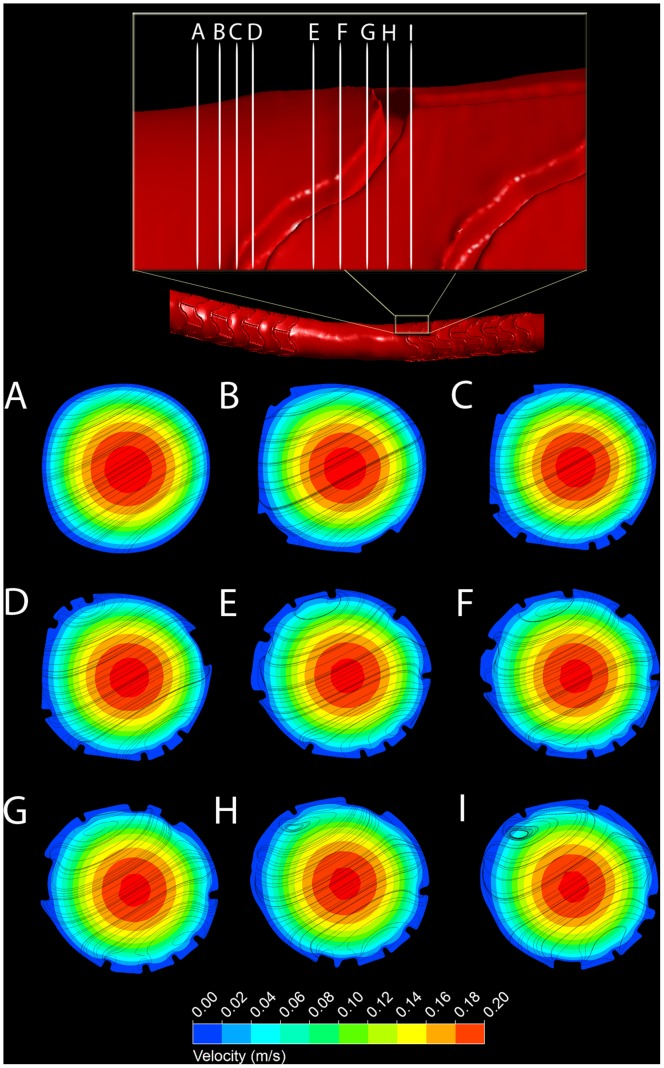
Figure 7. Velocity contours and secondary flow around individual stent struts in a porcine left coronary artery.
Top: Overview and close-up of reconstructed surface of arterial lumen negative obtained by µCT of a corrosion cast. The labels A to I indicate the location of the cross-sections shown in the bottom panels. Bottom: Velocity contour plots at cross-sections A to I. To visualize secondary flow structures, streamlines are derived from velocity vectors projected onto the respective cross-section.

