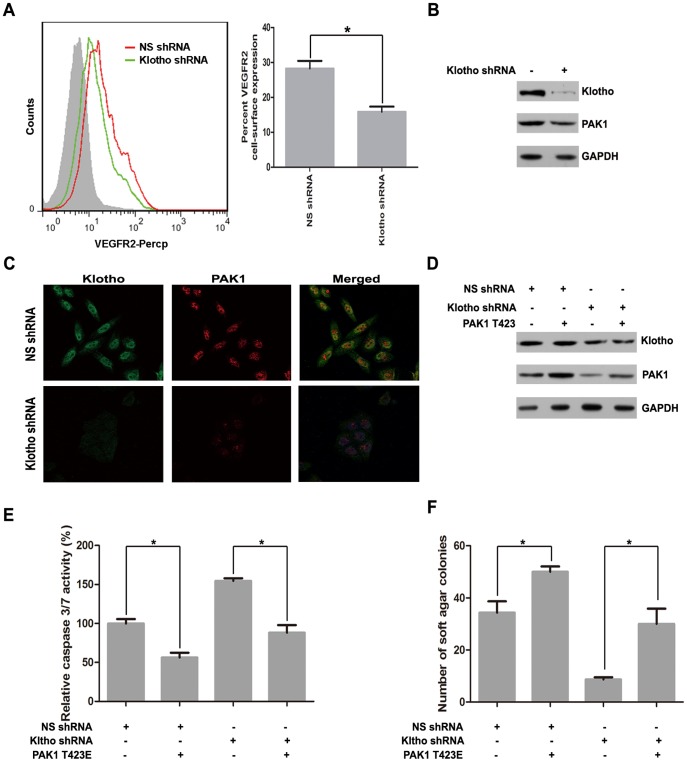
Figure 9. Decreased Klotho expression inhibits VEGFR2/PAK1 signaling.
(A) Flow cytometry analysis for VEGFR2 expression in BEL7402 cells stably transfected with nonspecific shRNA, and Klotho 1# shRNA, respectively. (B) Western blot analysis of PAK1, Klotho and GAPDH protein levels and (C) immunofluorescence staining of PAK1 and Klotho for BEL7402 cells stably transfected with nonspecific shRNA, and Klotho 1# shRNA, respectively. (D) Western blot analysis of PAK1, Klotho and GAPDH for BEL7402 cells stably transfected with nonspecific shRNA, and Klotho 1# shRNA, respectively, in the absence or presence of constitutive active mutant PAK1 T423E transfection. (E) Caspase 3/7 activity assay and (F) Colony formation assay after 48 hours detachment for BEL7402 cells stably transfected with nonspecific shRNA and Klotho1# shRNA, respectively in the absence or presence of constitutive active mutant PAK1 T423E transfection. The graphic profiles represent the mean of three independent replicates in each group with standard error bars and were statistically analyzed with a t test (*, P <0.05).

