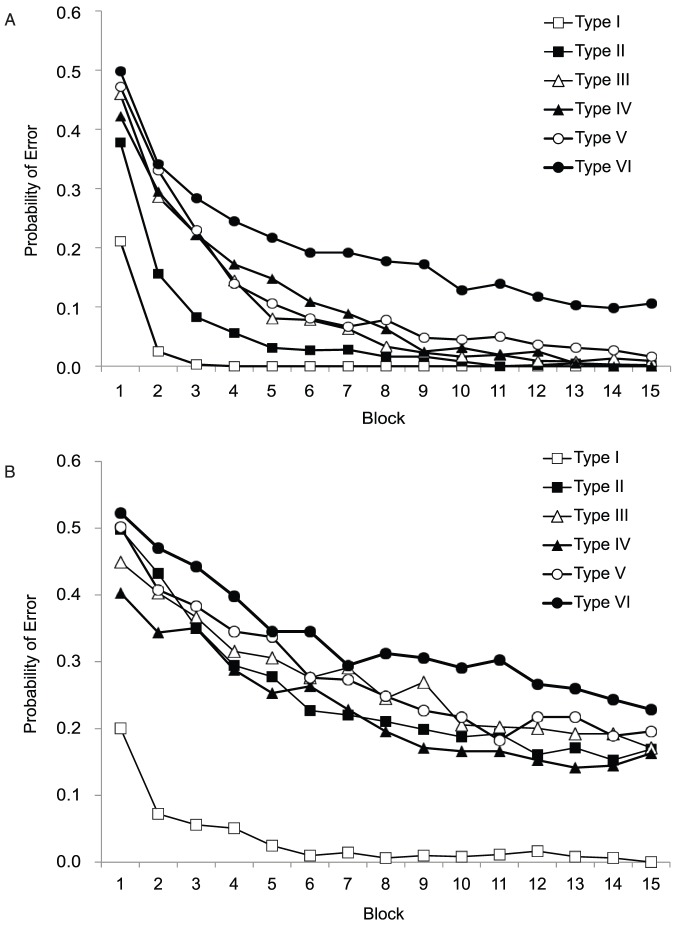
Figure 8. Cognitive Learning: A comparison between the learning curves reported in Nosfosky et al. (1994) data and the AMT replication data in Experiment 8.
The probability of classification error as a function of training block. The top panel shows the learning curves estimated by Nosfosky et al. [38] using 120 participants (40 per learning problem) who each performed two randomly selected problems. The right panel shows our AMT data with 228 participants, each who performed only one problem (38 per condition). We ended the experiment after 15 blocks, although Nosofsky et al. stopped after 25. Thus, the Nosofsky et al. data have been truncated to facilitate visual comparison.

