
Figure 9. Cognitive Learning: The average number of block to criterion for each problem, an index of problem difficulty.
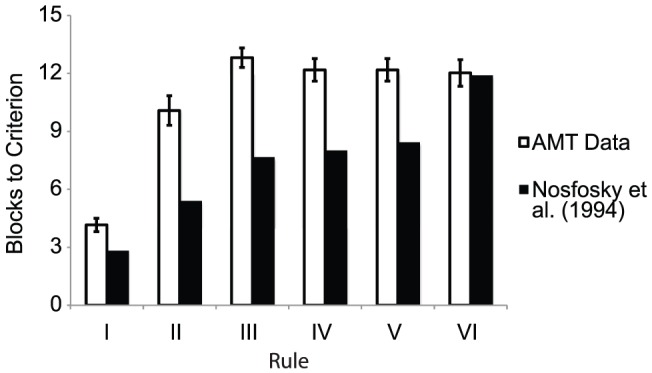
The average number of blocks it took participants to reach criterion (2 blocks of 16 trials in a row with no mistakes) in each problem. The white bars show the estimated average number of blocks to criterion reported by Nosofsky et al. [38].