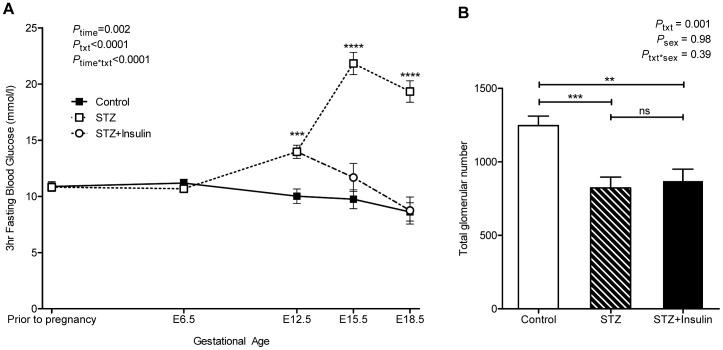
Figure 2. Maternal blood glucose concentrations and glomerular number in offspring of E18.5 cohort.
(A) 3 hour fasting blood glucose concentrations of control (solid line, filled square), STZ-treated (dashed line, open square) and STZ+Insulin-treated (dashed line, open circle) dams throughout gestation. (B) Total glomerular number in kidneys of control (clear bar), STZ-treated (striped bar) and STZ+Insulin-treated (solid bar) embryos. Glucose analysis by repeated measures two-way ANOVA for maternal STZ and insulin treatment and time followed by Fishers LSD post hoc analysis; (n) = control (11), STZ (8), STZ+Insulin (5). Glomerular number analysis by two-way ANOVA for maternal STZ and insulin treatment and offspring sex followed by Fishers LSD post-hoc analysis; (n) = control (7 litters comprising 20 kidneys), STZ (6 litters comprising 14 kidneys), STZ+Insulin (5 litters comprising 10 kidneys). Values are mean±SEM. **p<0.01, ***p<0.001 ****p<0.0001 vs. control.

