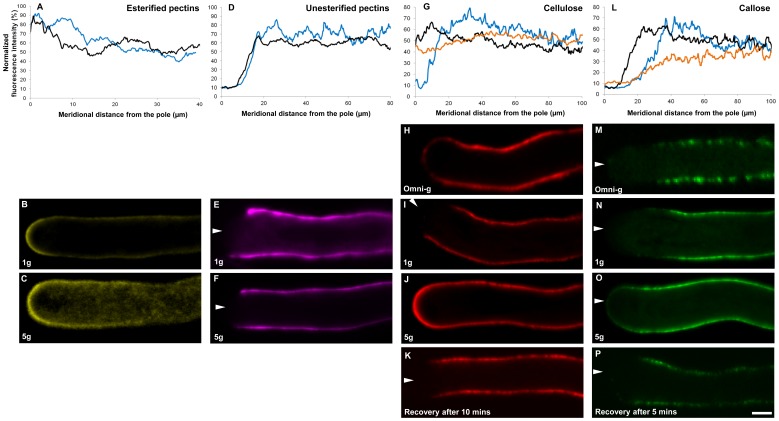
Figure 3. Effect of gravity stress on spatial distribution profile of cell wall components.
Spatial distribution of esterified pectins (A,B,C), unesterified pectins (D,E,F), cellulose (G,H,I,J,K), and callose (L,M,N,O,P) in Camellia pollen tubes grown under omnidirectional-g (orange curve), 1 g (blue curve) and 5 g conditions (black curve). Relative label intensities were quantified along the meridional tube surface measured on z-stack projections and normalized to the highest pixel intensity before averaging (n>10 tubes per sample) (A,D,G,L). Corresponding typical fluorescence micrographs of median optical sections (B,C,E,F,H,I,J,M,N,O) are displayed for the different g-accelerations. Recovery of the typical spatial profile observed at 1 g for cellulose and callose was observed at 5 min after removal from the centrifuge (K,P). Specific label was performed using JIM7 and JIM5 antibodies, directed against highly esterified and unesterified pectins, respectively, Cellulose Binding Module 3A against crystalline cellulose and anti (1→3)-β-glucan against callose. Arrowheads mark the position of the pollen tube tip where invisible. Bar = 10 µm.

