
Figure 4. Slow fluctuation of cross-frequency modulation in PMC.
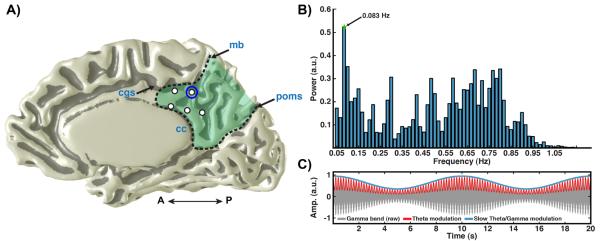
A) Medial view of PMC electrodes (right hemisphere) in subject 4 (labeling as per Fig. 1). B) Power spectrum of theta/HG modulation time series (see methods) for a PMC electrode in A (circle red). Spectrum shows a clear peak at 0.08 Hz (arrow). C) Schematic of the slow modulation of theta/HG cross-frequency coupling (synthetic signal). Ongoing theta modulated (red line; 5 Hz) gamma band oscillations (gray shading; 70–180Hz) fluctuates in magnitude at a slow time scale (blue line; 0.1 Hz).