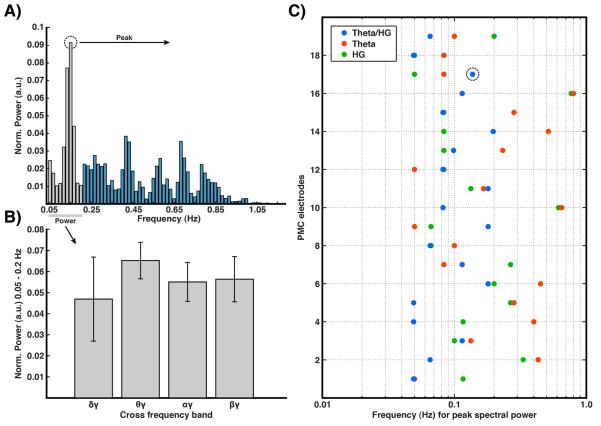
Figure 5. Slow fluctuation across additional frequency bands in PMC.
A) Example power spectrum of theta/HG modulation time series (as per figure 4b) for a single PMC electrode in subject 1. B) Mean normalized power between 0.05–0.2 Hz, highlighted gray in A, for delta/HG, theta/HG, alpha/HG and beta/HG modulation time series for all PMC electrodes. Given insufficient statistical power, theta/HG produced the greatest power within this range but was not statistically significant. C) Peak frequency of slow modulation spectrum (as shown in A) for theta/HG cross-frequency modulation as well as for theta and HG bands independently across all PMC electrodes. Theta/HG modulation shows consistent spectral peaks distributed around 0.1 Hz (mean 0.10 Hz), with HG and theta bands showing similar, though more varied, peak frequencies. Quantitatively, the standard deviation was clearly greater for the theta and gamma bands alone (0.22 & 0.19, respectively) than for the theta/gamma pair (0.05). A repeated measures analysis of variance showed the variance to be significantly different between these bands (F(2,36) = 6.21, p<.01).

