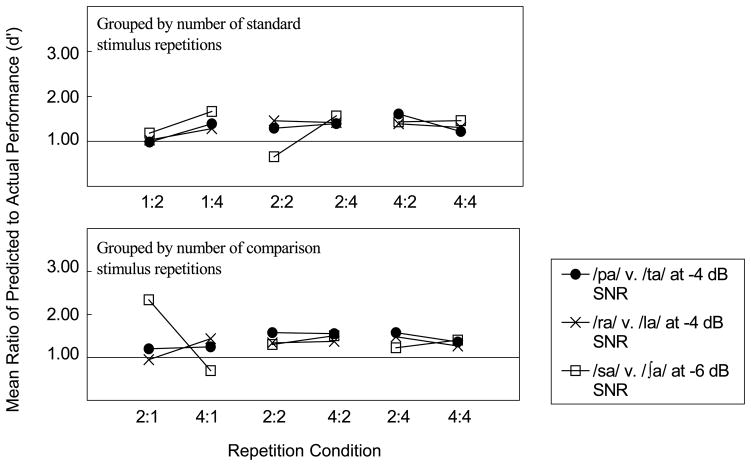
Figure 9.
Mean ratio of predicted to actual performance (based on multiple looks). The top panel displays the effects of doubling the number of comparisons. The bottom panel shows the effects of doubling the number of standards. The filled circles represent the /pa/ versus /ta/ comparison at −4 dB SNR, the /ra/ versus /la/ comparison at −4 dB SNR is represented by “X”s, and the open squares represent the /sa/ versus /ʃa/ comparison at −6 dB SNR.

