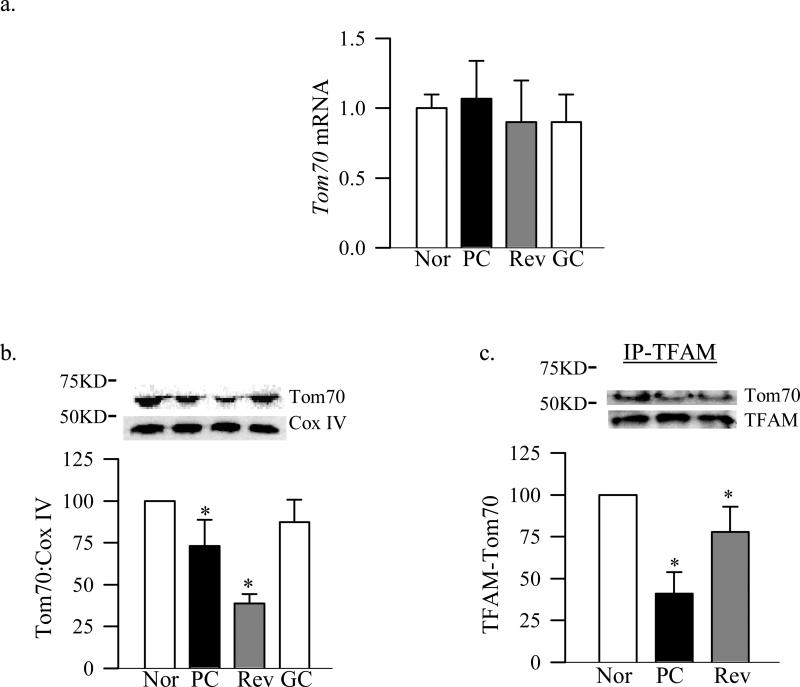
Figure 1.
Effect of diabetes and cessation of hyperglycemia on Tom70 and its binding with TFAM. Tom70 (a) gene expression was quantified by qPCR using specific rat primers and β-actin as an internal control, and (b) protein expression in the mitochondria was assessed by western blot analysis using Cox IV as a loading control and Precision Plus standard protein markers (10-250KD, BioRad, Hercules, CA) . (c) Binding of TFAM with Tom70 was performed by immunoprecipitating TFAM, followed by western blot analysis for Tom70. TFAM was used as the loading control. The values are represented as mean ±SD from five to seven animals in each group: Nor- normal, PC- poor glycemic control for ~8 months, Rev- poor glycemic control for ~ 4 months followed by ~4 months good control and GC- good glycemic control for ~8 months. *P<0.05 compared with normal.

