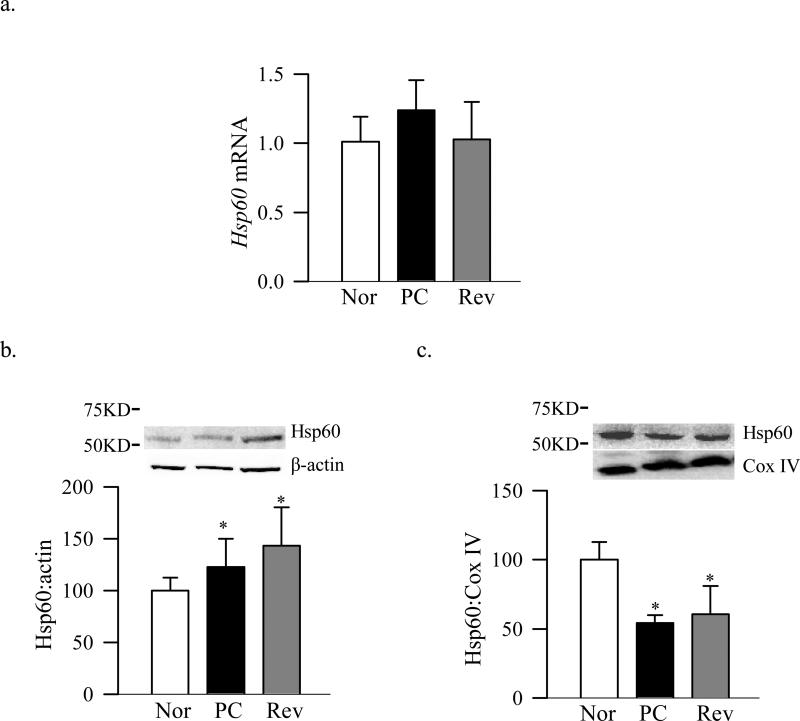
Figure 4.
Effect of diabetes and the termination of hyperglycemia on the retinal Hsp60. (a) Hsp60 gene expression was quantified by qPCR using β-actin as internal control. Protein expressions of Hsp60 in the (b) cytosol and (c) mitochondria were analyzed by Western blot technique using β-actin and Cox IV as a loading control respectively. The values are represented as mean ±SD from four to six animals in each group. *P<0.05 compared with normal.

