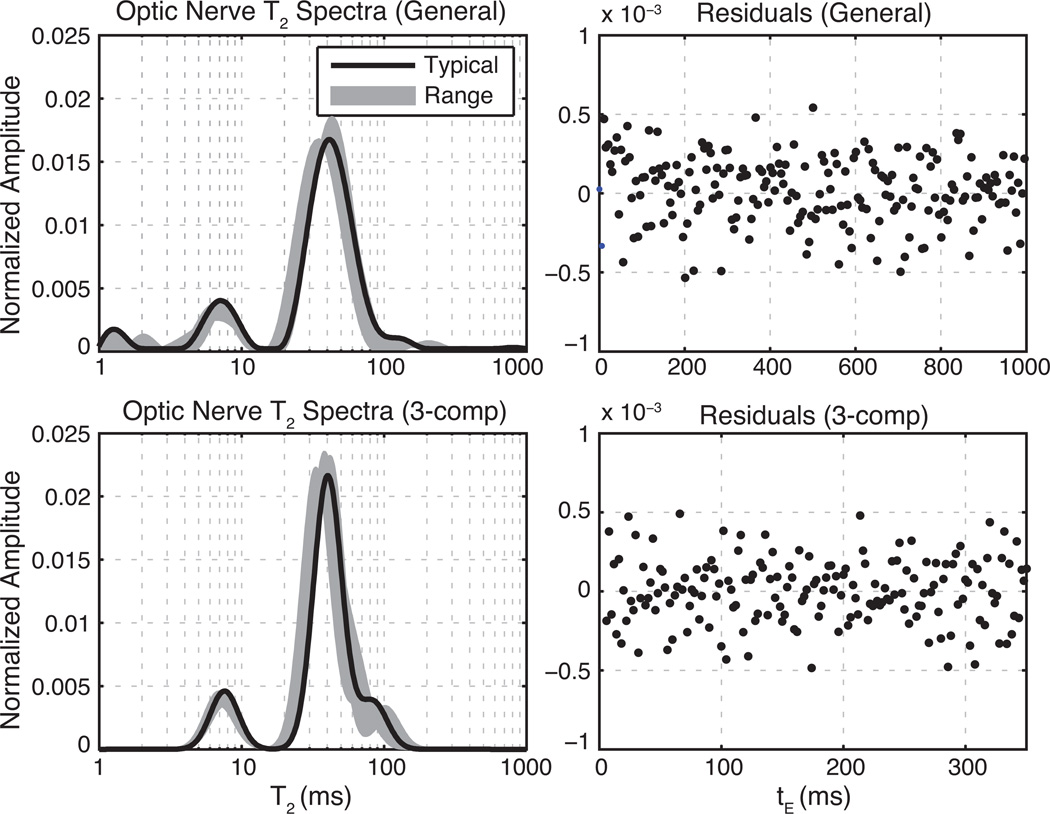
Fig. 3.
Equilibrium T2 spectra of optic nerve at 9.4 T. Left panels show fitted T2 spectra and right panels show residuals from a typical sample fit normalized to the maximum echo amplitude. Top panels show results of fitting the full echo train with only non-negative and minimum curvature constraints. The bottom panels show the results of fitting the truncated echo train with three Gaussian-shaped T2 components. For clarity, only every 5th residual is plotted in the upper right frame.

