
Figure 2.
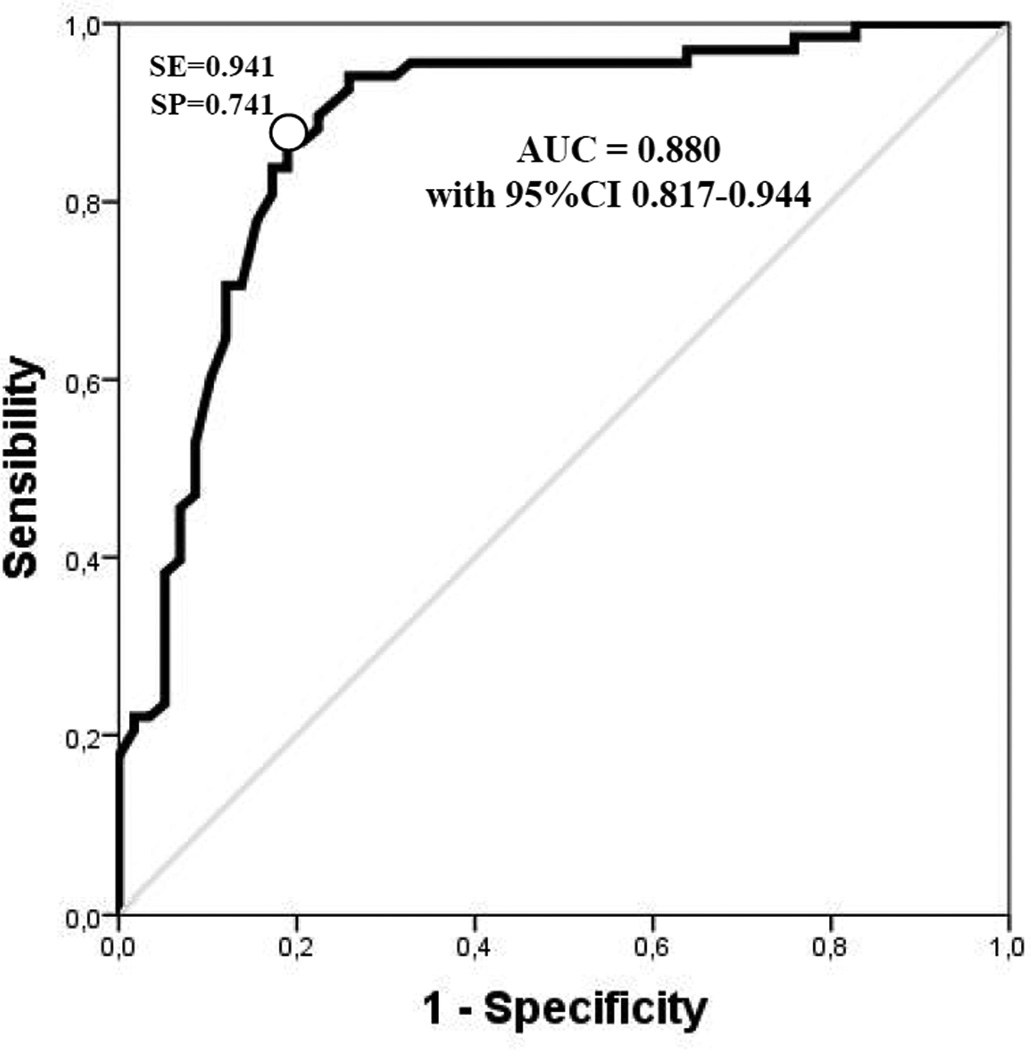
Receiver Operating Characteristic (ROC) curve for DNA methylation and cancer diagnosis. AUC, Area Under Curve = 0.880 with 95%CIs 0.817–0.944. The white point on the ROC curve corresponds to the 4.74% methylation and % sensibility (SE) and % specificity (SP) are indicated at that point (SE=0.941; SP=0.741).