Figure 1.
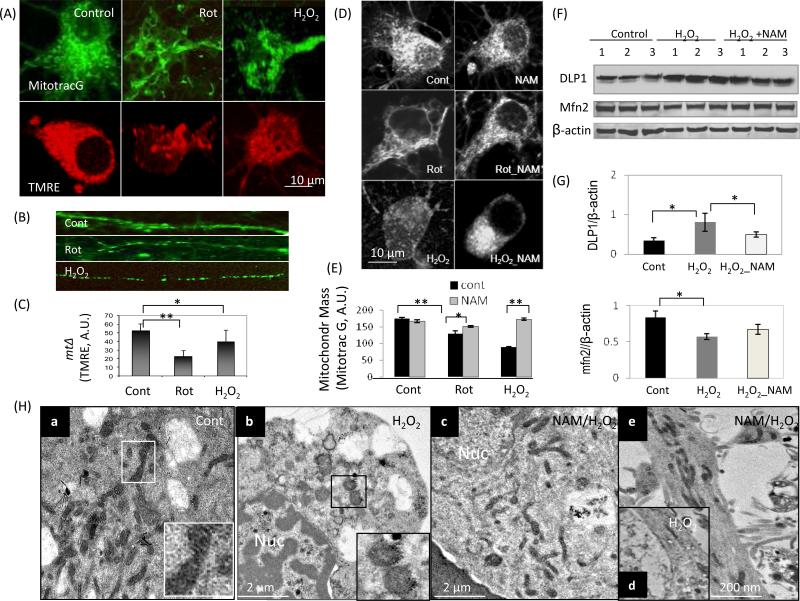
NAM preserves mitochondrial mass, morphology and functionality under conditions of oxidative stress in neurons. Cortical neurons were loaded with the fluorescent probe MitoTracker Green (MitoTracG) and the mitochondrial membrane potential (MMP) indicator TMRE following exposure to vehicle (Control), H2O2 (20 μM) or rotenone (1 μM) for 6 h. (A) Representative images showing mitochondrial morphological changes with reduced mitochondrial mass (MitoTrac Green) and MMP (TMRE) in neurons exposed to oxidative stress. Images are representative of more than 40 neurons examined in each group. (B) Reduced mitochondrial size and loss of the normal elongated shape of the mitochondria occurred in neuronal processes (MitoTracker Green) after exposure of neurons to the indicated oxidative insults. (C) MMP is reduced in neurons exposed to oxidative insults. Values are the mean ± SD of measurements made on 3-4 separate cultures (10-15 neurons evaluated/culture). *p<0.05. **p<0.01. (D and E) NAM treatment preserves mitochondrial mass in neurons exposed to oxidative stress. Values are the mean ± SD of measurements made on 3-4 separate cultures (10-15 neurons evaluated/culture). (F) Levels of DLP1 (a mitochondrial fission-related protein) were elevated in cells exposed to oxidative insults, and NAM treatment attenuated the DLP1 response to oxidative stress. Levels of the mitochondrial fusion protein mfn2 were reduced in cells exposed to oxidative stress. (G) Densitometric values of protein bands (normalized to the β-actin band). Values are the mean ± SD of determinations made on samples from 3 different experiments (samples from 6-7 cultures/experiment were pooled). *p<0.05. (H) Electron microscopy showing ultrastructural alterations in neurons caused by exposure to H2O2 (20 μM) for 6 h. Panel a shows a neuron in a control culture with the inset showing an enlarged view of the boxed area in the lower magnification image. The images illustrate the ‘healthy’ appearance of the mitochondria which are elongated with cristae evident. Panel b shows a neuron in a culture that had been exposed to hydrogen peroxide for 6 h, with the inset showing an enlarged view of the boxed area in the lower magnification image. The latter images illustrate abnormal mitochondria which are round and swollen, with cristae damaged. Panels c and e show neurons that were treated with NAM and then exposed to hydrogen peroxide; mitochondria in the cell body (panel c) and neurites (panel e) appear healthy. Panel d shows the loss of mitochondria in a neurite of a neuron exposed to hydrogen peroxide. Nuc, nucleus.

