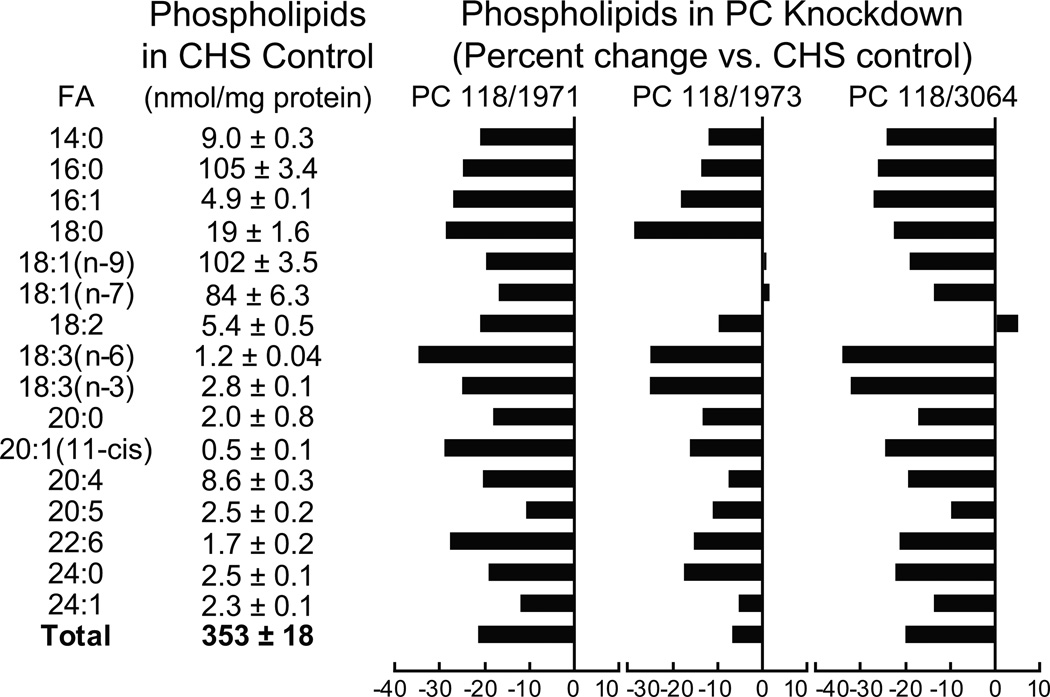
Figure 2. Lower levels of many individual and total lipids in five lipid classes in glucose-stimulated INS-1 832/13-derived cell lines with knocked down pyruvate carboxylase.
The contents of lipids in the CHS control cell line are shown in table format and the percent increases or decreases in individual lipids in the pyruvate carboxylase knockdown cell lines are shown in bar graph format. The levels of knockdown of pyruvate enzyme activity in the PC118/1971, PC118/1973 and PC118/3064 cell lines were 88%, 60% and 78%, respectively (from reference 24). Cells were incubated in the presence of 11.1 mM glucose (a concentration of glucose that gives near maximal insulin release in the INS-1 832/13 cell line) in Krebs Ringer bicarbonate solution, pH 7.3, for 40 minutes before cells were harvested for lipid analysis. The number of replicate incubations were 6 per cell line except for PC118/1973 where N = 3. For clarity standard error bars are not shown in the graphs.

