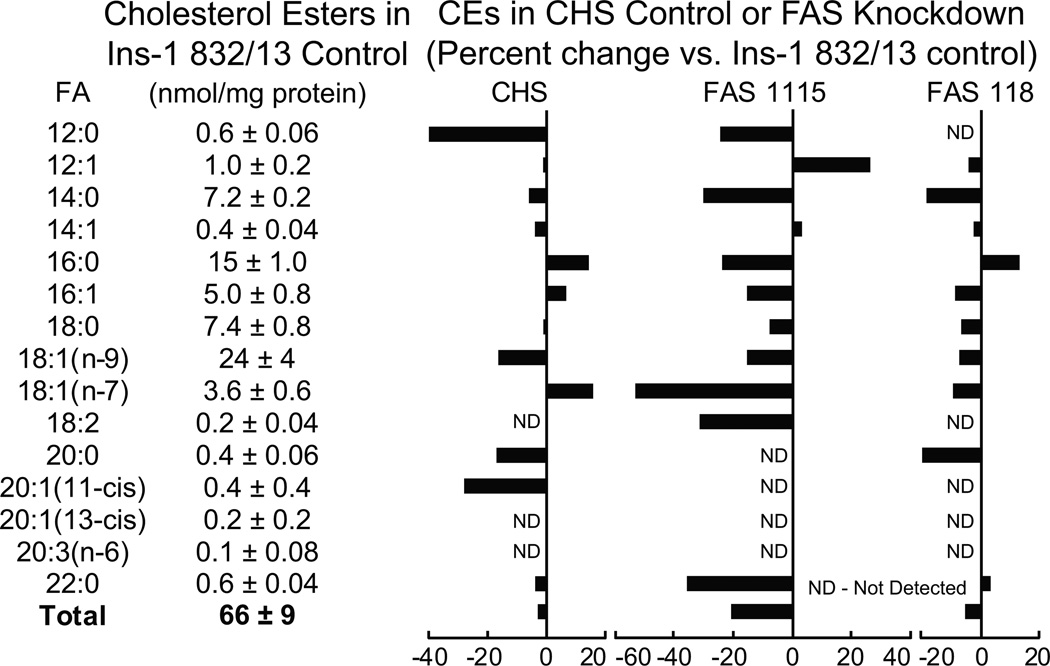
Figure 7. Lower levels of individual and total lipids in INS-1 832/13-derived cell lines with knocked down fatty acid synthase.
The contents of the lipids in the INS-1 832/13 parent cell line are shown in table format and the percent increases or decreases in the CHS cell line that contains a nontargeting DNA sequence and the two cell lines, FAS115 and FAS118, containing a stably integrated DNA sequence that targets fatty acid synthase (FAS) mRNA, are shown in bar graph format. Cells were maintained in RPMI 1640 medium containing 10% fetal bovine serum and 5 mM glucose for 24 h before harvesting for lipid analysis. Results are the mean ± SE for 3 replicate incubations for each cell line. To increase clarity standard error bars are not shown in the graphs.

