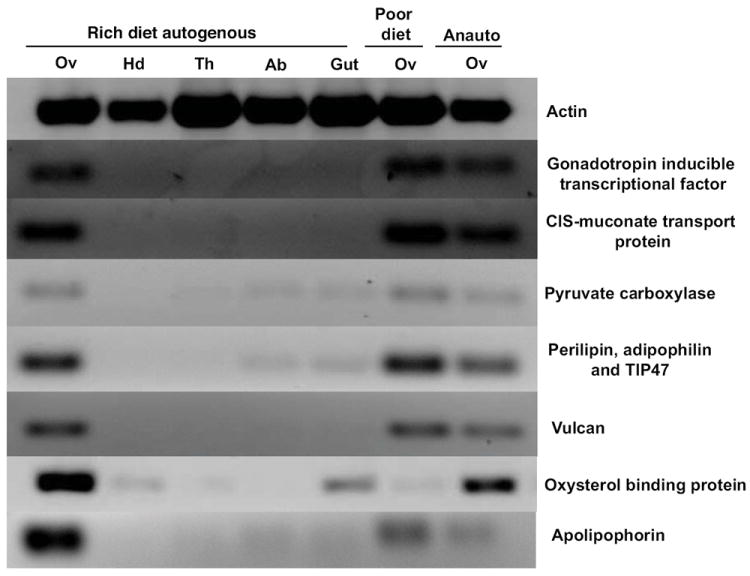
Figure 1.

RT-PCR analysis of the tissue distribution of six gene transcripts in relation to female nutritional condition and reproductive stage along with tissue-specific and loading controls (Gc. atropalpus actin). Rich diet autogenous = tissues collected from autogenous females derived from larvae fed ad libitum. Poor diet = ovaries only were collected from autogenous females derived from larvae fed low amounts of food. Anauto = ovaries from newly anautogenous females that are developmentally arrested at Christopher’s stage 1. Ov = ovary pairs, Hd = head, Th = thorax, Ab = abdominal wall, Gu = gut.
