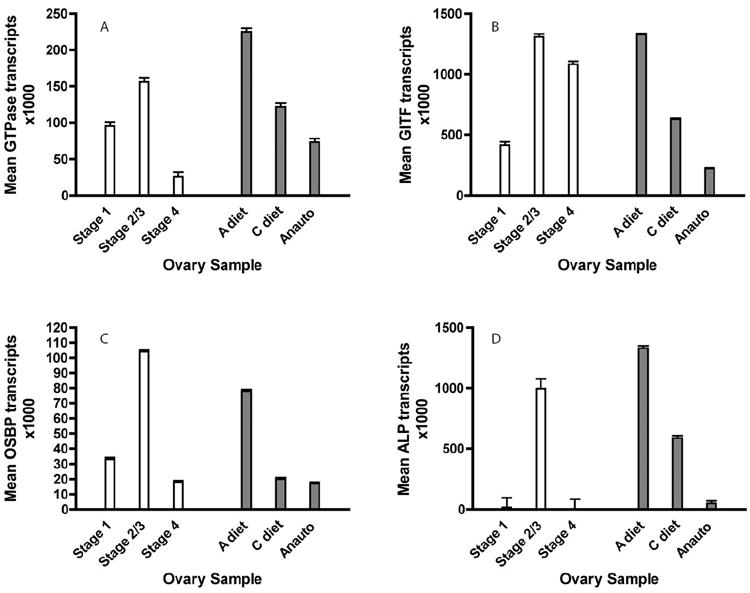
Figure 2.

Real-time quantitative PCR (qPCR) analysis of gene transcripts in ovaries at discrete stages of Gc. atropalpus autogenous follicle development (Stages 1 – 4, white bars), in relation to rich- or poor- female nutritional condition during autogenous oogenesis (A -, C-diet, gray bars), and reproductive state (anautogenous, follicles arrested at Christophers stage I, gray bars). Graphs display mean estimated transcript copies X 1000 ± s.e.m for (A) GcaGTPase (Ras-small GTPase), (B) GcaGITF (gonadotropin inducible transcription factor), (C) GcaOSBP (oxysterol binding protein), and (D) GcaALP (apolipophorin III). Error bars represent s.e.m.
