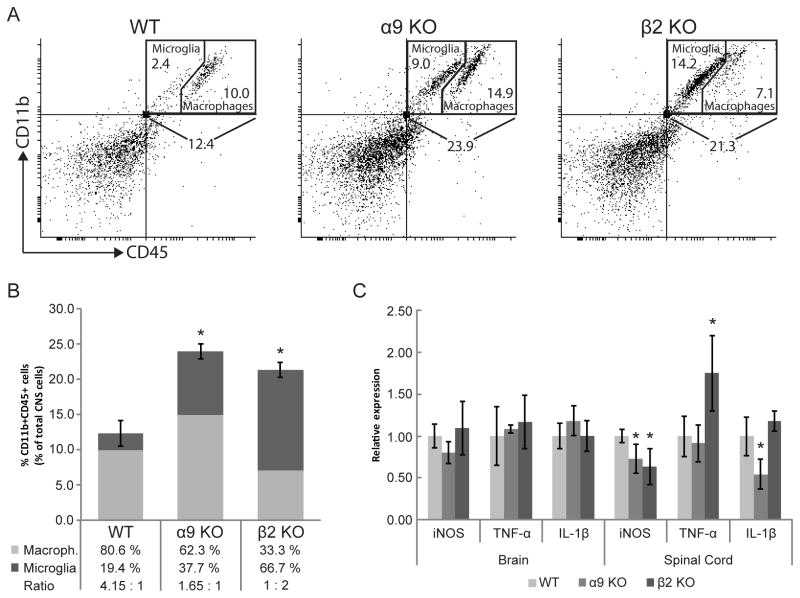
Figure 2. Myeloid cell numbers and cytokine production in the CNS of nAChR α9 or β2 subunit knock-out mice.
WT, α9 KO or β2 KO mice were immunized with MOG35–55 and sacrificed 7 days later. A, Myeloid cells (CD11b+/CD45+) within the entire population of brain and spinal cord cells were discriminated from other CD11b−/CD45− leukocytes, neurons and glia by flow cytometry and further sub-divided into microglia (CD11b+/CD45med) or macrophage (CD11b+/CD45high) populations. B, Results are presented graphically for the percentages of myeloid cells relative to CNS cells and of ratios of infiltrating macrophages (light gray) to microglia (dark gray). Total myeloid cell numbers are increased, but ratios of infiltrating macrophages to microglia are significantly lower in the CNS of α9 KO or β2 KO EAE mice compared to in WT EAE mice. C, mRNA levels for the indicated genes in α9 KO or β2 KO EAE mice were assessed by qRT-PCR and are presented normalized to levels in WT EAE mice (*p<0.05). Error bars represent S.E.M.

