Figure 6.

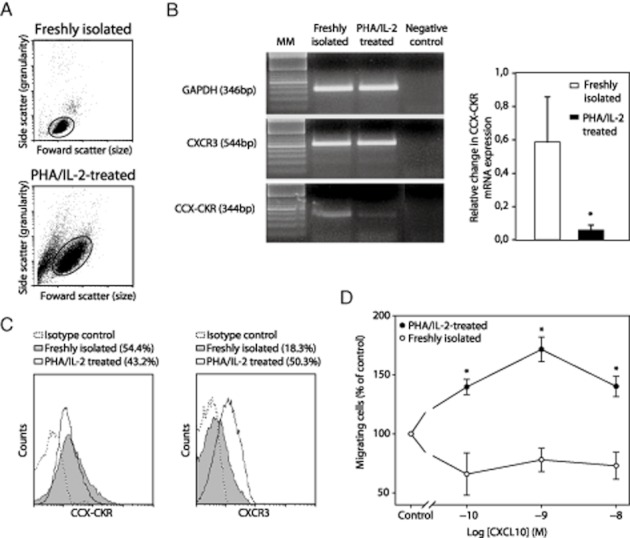
Expression of hCCX-CKR in freshly isolated and in activated T cells. (A) Freshly isolated T cells and PHA/IL-2-activated T cells were sorted by FACS. (B) RT-PCR analysis show that freshly isolated T cells express both hCXCR3 and hCCX-CKR mRNA. Activated T cells display similar levels of hCXCR3 mRNA as freshly isolated T cells but levels of hCCX-CKR mRNA were considerably lower. * = P < 0.05. (C) FACS analysis revealed that 54.4% and 18.3% of freshly isolated T cells expressed hCCX-CKR and hCXCR3, respectively. hCCX-CKR expression dropped to 43.2% in activated T cells whereas a major up-regulation (50.3%) of hCXCR3-expressing-T cells was observed following activation. (D) Chemotaxis experiments show that freshly isolated T cells failed to migrate towards CXCL10 whereas PHA/IL-2-activated T cells demonstrated a prominent migratory behaviour towards the chemokine. * = P < 0.05 compared with control.
