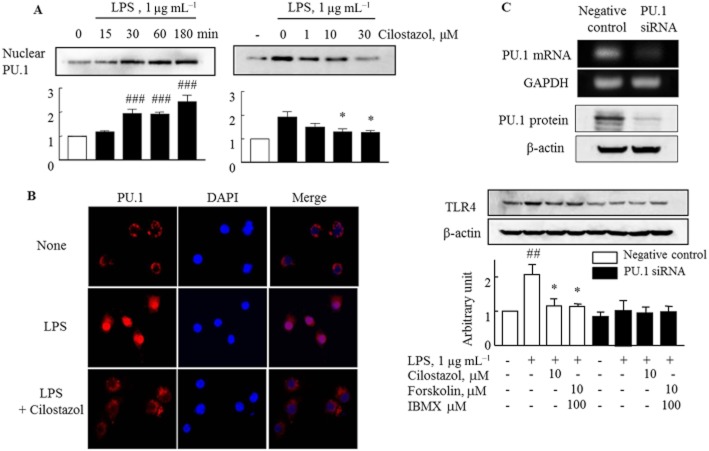
Figure 2.
Effects of LPS and cilostazol on expression of PU.1 transcription factor in the RA macrophages. (A) Time-dependent increase in PU.1 expression by LPS (left) and concentration-dependent decrease in PU.1 expression by cilostazol (right) in the nuclear fraction of RA macrophages. (B) Confocal microscopic images detecting nuclear localization of PU.1 (red) and DAPI (blue) in the presence of LPS for 1 h under treatment with and without cilostazol (10 μM, for 4 h) in RA macrophages. (C) Analysis of PU.1-knockdown cells: PU.1 mRNA and protein expression were reduced, in contrast to negative controls (Ca). In PU.1-knockdown cells, LPS and cilostazol showed little effect on TLR4 expression, in contrast to the findings in negative control cells (Cb). Results are expressed as the mean ± SEM of four experiments. ##P < 0.01; ###P < 0.001 versus no treatment; *P < 0.05 versus LPS alone.

