
Figure 5.
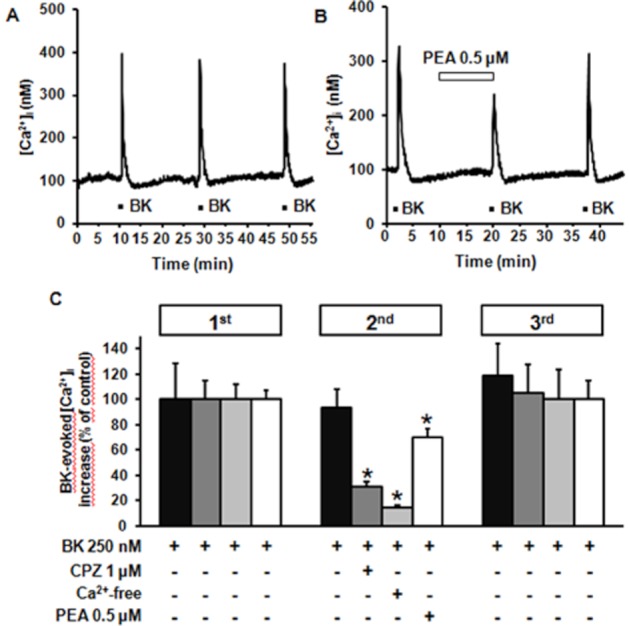
Effect of BK on [Ca2+]i in differentiated F11 cells. Representative traces showing the effect of three subsequent exposures to BK (250 nM) on [Ca2+]i in differentiated F11 cells obtained in control conditions (A) or after exposure to 0.5 μM PEA 10 min before and during the second BK exposure (B). (C) Quantification of the effects of 1 μM CPZ, of a Ca2+-free extracellular solution, and of 0.5 μM PEA on BK-induced [Ca2+]i increase (second BK exposure), and of drug washout during the third BK exposure. Data are expressed as percent of [Ca2+]i increase relative to controls (250 BK in the first pulse). Each point is the mean±SEM of 20–34 separate determinations performed in at least three experimental sessions.