Figure 4.

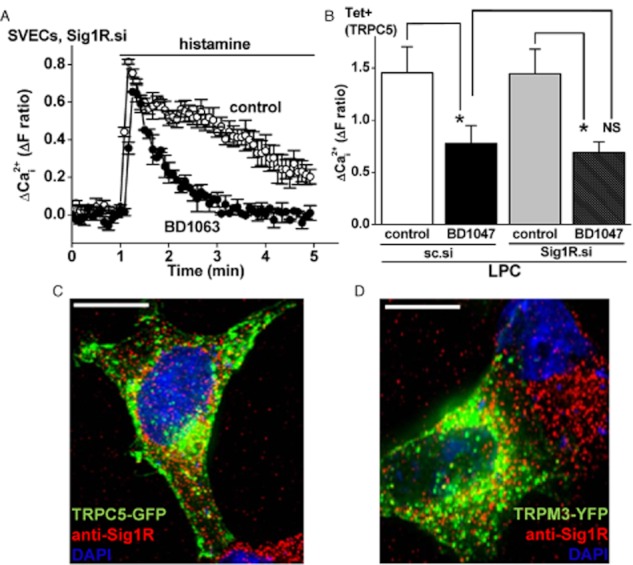
Lack of role of the Sig1R. (A) Example of Ca2+ measurement results for the effect of 50 μM BD1063 (30 min treatment) on 10 μM histamine-evoked Ca2+ signals in SVECs treated with Sig1R siRNA (Sig1R.si). (B) Mean Ca2+ measurement data for the maximum responses to 10 μM LPC in TRPC5-expressing HEK 293 cells treated with sc.si (control) or Sig1R.si and then exposed to 100 μM BD1047 or vehicle control (n/N = 3/16 for each condition). (C, D) Merged images showing typical non-induced HEK 293 cells transiently expressing TRPC5-GFP (C) or TRPM3-YFP (D). Fluorescence from the GFP or YFP is in green. Cells were stained with anti-Sig1R antibody (red) and the nuclear stain DAPI (blue). Cells were pretreated with 100 μM SKF10047 (C) or BD1047 (D). The scale bars are 10 μm.
