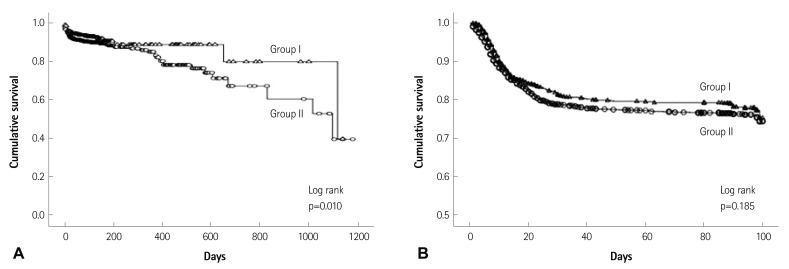
Fig. 2.
Kaplan-Meier survival curve for two groups associatd with patient survival and adverse events. A: survival curve in patients with heart failure. B: in hospital and mid-term adverse events in patients with heart failure. Group I: patients with metabolic syndrome, Group II: patients without metabolic syndrome.

