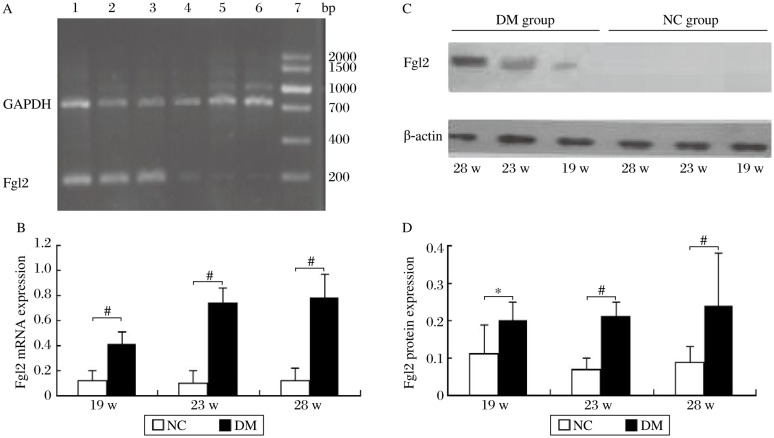
Fig. 4. Quantification of fgl2 protein and mRNA expression in the diabetic and normal rats (n = 8).
A: Agarose gel electrophoresis of fgl2 and GAPDH mRNA amplification products. Lane 1-3 and Lane 4-6 represent the mRNA expression in the 19th, 23rd and 28th week of the diabetic (DM) group and the normal control (NC) group, respectively. Lane 7: DNA maker. B: Fgl2 mRNA expression of renal tissue. C and D: Fgl2 protein expression in renal tissue by Western blotting analysis. *P < 0.05 and #P < 0.01 compared to the NC group.

