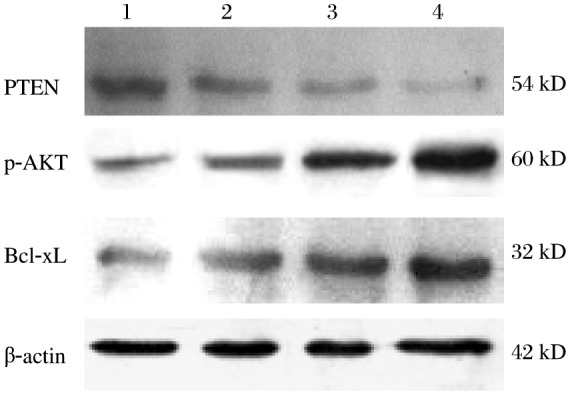
Fig. 2. Effects of UVB treatment on PTEN protein expression.

HaCaT cells were treated with different UVB concentrations and PTEN, P-AKT, and Bcl-xL levels were assayed by Western blotting. Equal amounts of total cellular protein were resolved by 10% SDS-PAGE, and β-actin was used as an internal control. Lane 1: untreated control group; Lane 2: 30 mJ/cm2 UVB-treated group; Lane 3: 60 mJ/cm2 UVB-treated group; Lane 4: 90 mJ/cm2 UVB-treated group.
