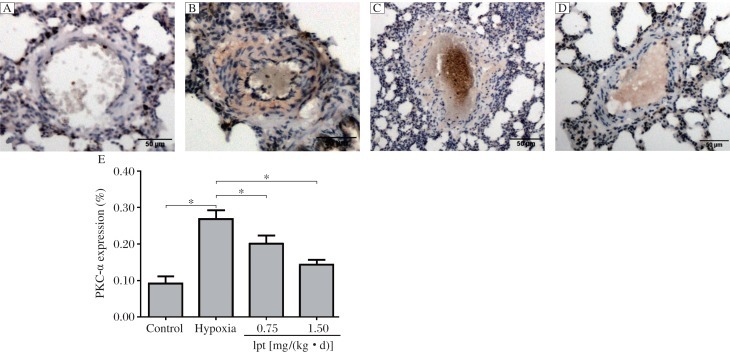
Fig. 3. The expression of PKC-α in the lungs was detected by immunohistochemical staining (Magnification: ×200).
A: the control group. B: the hypoxia group. C: the iptakalim treatment group [0.75 mg/(kg • d)], D: the iptakalim treatment group [1.5 mg/(kg • d)]. E: effects of iptakalim on PKC-α expression (represented by the mean percentage changes in mean optical intensity) in the vessel wall of pulmonary arterioles of rats with chronic hypoxia-induced pulmonary hypertension. *P < 0.05. Ipt: iptakalim.

