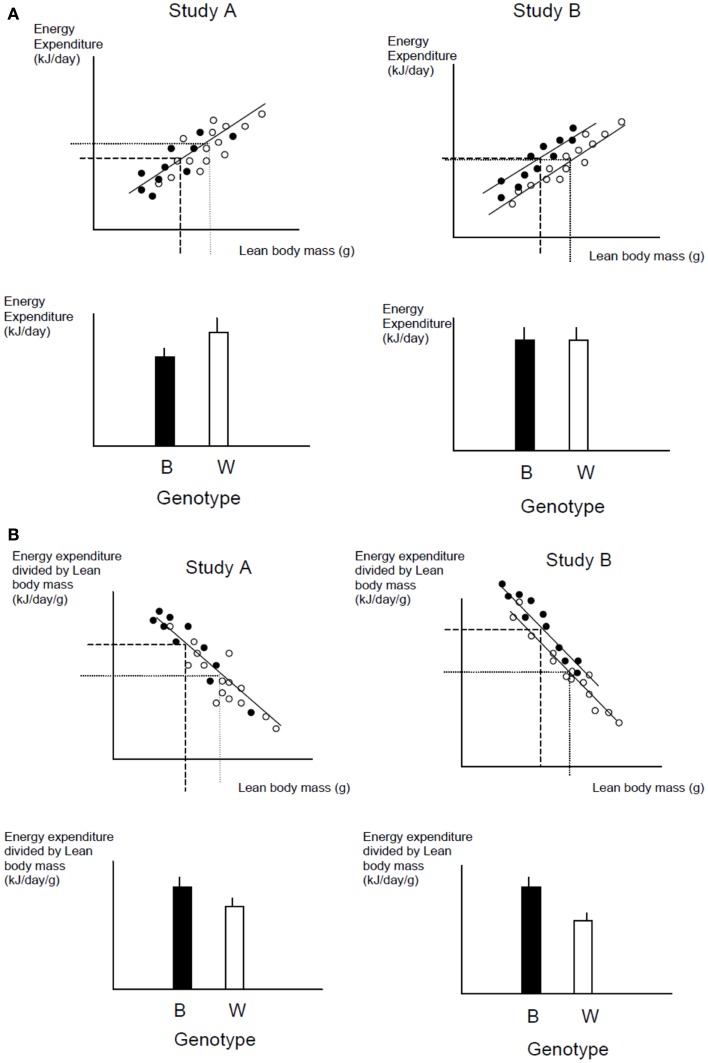
Figure 11.
(A) Hypothetical data from two studies of two different genotypes (black and white). In both studies there is a lean body mass difference between the two genotypes. In study (A), however, the data for energy expenditure lie on a common line in relation to lean body mass. There is no difference in their energy expenditure apart from an effect due to lean body mass. In study (B), the data for expenditure lie on two separate lines relative to lean body mass. In this situation, there is an effect of the genotype on expenditure independent of any mass effect. The challenge is to find an analysis that separates these two situations. If we use the raw data and average across the individuals for each genotype, the results shown below the plots as histograms reveals that there is a significant difference in study (A), with energy expenditure of the black genotype being lower than that of the white one, whereas in study (B), there is no significant difference in energy expenditure between the genotypes. To see if there is a genotype effect on expenditure independent of any effect of lean body mass we may divide the energy expenditure by BW (B). The result in study (B) now reveals that expenditure in the black genotype is higher than that in the white genotype. However, this division also reveals a significant effect in study (A), where none actually exists. The problem is that the division by lean mass overcompensates for the mass effect.

