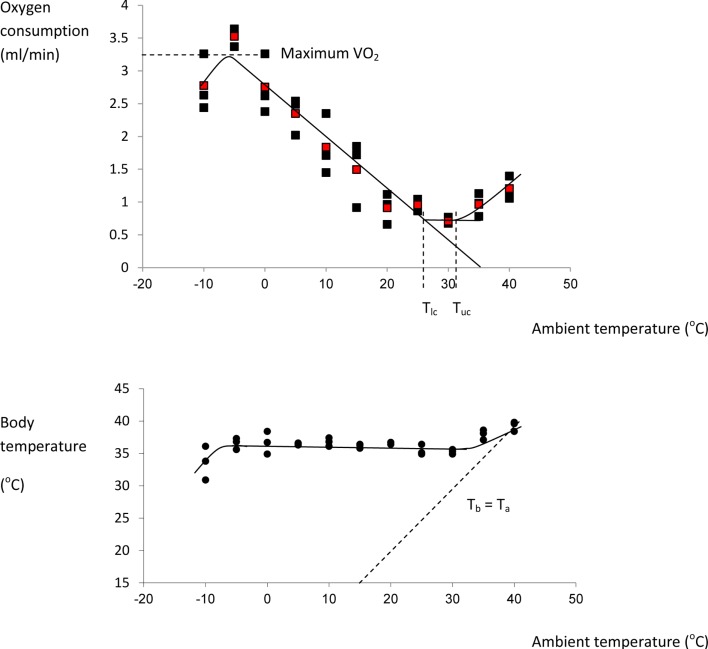
Figure 5.
Thermoregulation curve for the male MF1 mouse. Individuals were measured for 3 h at 30 s intervals at each temperature in a single chamber-single analyzer system and the reported oxygen consumption was the lowest continuous 5 min period over the 3 h. Each point represents a different individual. Red points are means at each temperature. Body temperature (lower plot) was measured after the individuals exited the chamber. The characteristic temperatures bordering the thermoneutral zone (lower critical: Tlc and upper critical: Tuc) are indicated on the upper plot, and the line of equivalence where body temperature (Tb) equals ambient temperature (Ta) is shown on the lower plot. (Data from Speakman, J. R., unpublished).

