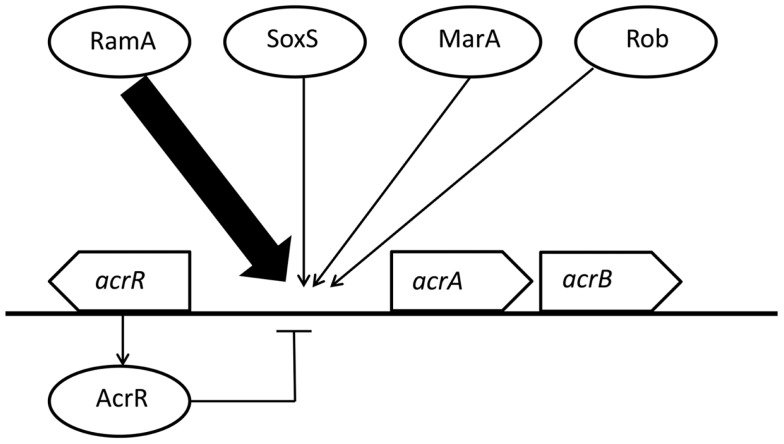
Figure 1.
Regulation of acrAB expression by multiple regulators in Salmonella Typhimurium and S. Haardt. This figure was produced using data from the literature (see main text). Functional interactions are represented as arrows for activation/induction and as “⊣” for repression. The size of arrows indicates the estimated impact.

