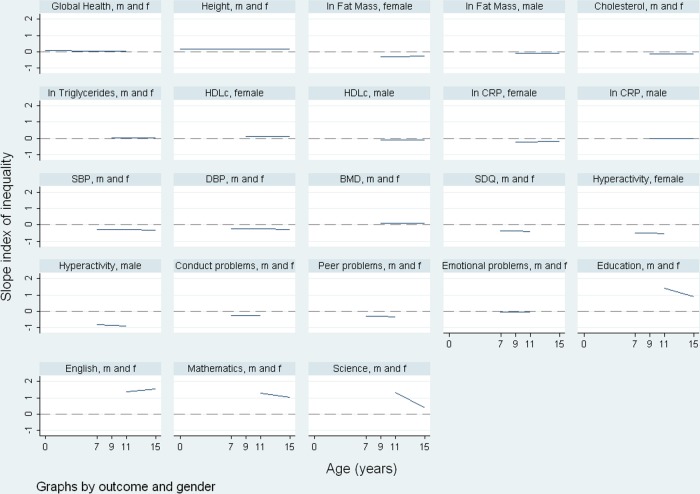
Figure 1.
The SII (slope index of inequality) is plotted against age for each outcome. All outcomes are standardised to have a mean of zero and a variance of one. The SII is the mean difference in SDs of the outcome between the highest and lowest maternal education. Graphs are presented for males and females combined ‘m and f’ if no evidence of gender interactions was found, or separately for males and females for outcomes where there was evidence of gender differences in the association with maternal education. Abbreviations of outcome names: BMD, bone mineral density; CRP, C reactive protein; DBP, diastolic blood pressure; HDLc, high-density lipoprotein cholesterol, SBP, systolic blood pressure; SDQ, summary score of behavioural difficulties measured by the strengths and difficulties questionnaire, education, summary score of attainment in tests in English, mathematics and science. This figure is only reproduced in colour in the online version.

