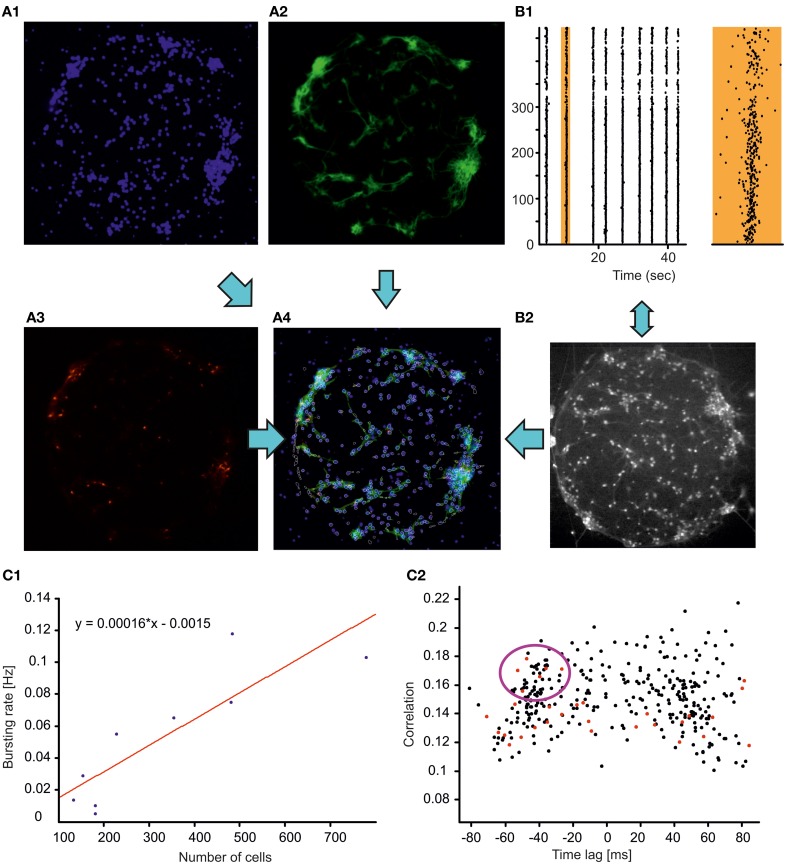
Figure 2.
Structure vs. function relations in neocortical finite circuits. (A) Immunocytochemical staining revealing cellular nuclei (blue, DAPI, A1), neuronal cells (green, MAPs, A2), GABAergic neurons (red, GAD67, A3). In panel (A4), the contours of the cells monitored through calcium imaging (white) are superimposed to the merged immunocytochemical pictures. (B) Monitoring the dynamics of the neuronal circuit through calcium imaging. Raster plot (B1 left plot) of the activity of the circuit (shown in panel A) displaying stereotyped spontaneous network synchronizations (broken vertical lines). The activity of a representative network synchronization (marked in orange) is shown with higher temporal resolution on the right orange plot (bottom scale bar 0.5 s). The cells loaded with the calcium indicator OGB are shown in the panel (B2) (objective magnification 10×, field of view 800 × 800 μm). (C1) Frequency of spontaneous synchronizations as a function of circuits' population size (blue dots, n = 9). The cell number was estimated by counting the cellular nuclei stained with DAPI. The result of the linear fit with least-squares regression (Pearson correlation coefficient 0.88) is represented by the red line and by the equation. (C2) Time lag—correlation graph for the circuit shown in (A) plotting for each imaged neuron the average correlation and average time of activation relative to all other cells (see section “Materials and Methods”). Red dots indicate GABAergic cells. The violet circle highlight GABAergic cells reliably activated at the synchronization build up possibly playing a key role in the orchestration of network synchrony similarly to what previously documented for the developing hippocampal circuits (Bonifazi et al., 2009).

