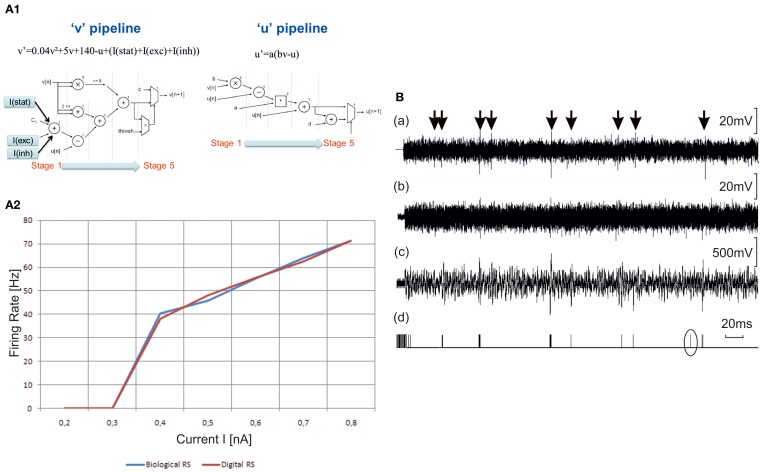
Figure 7.
Hardware elements for the neuro-prosthesis. (A1) Choice of the topology. To implement the two equations of Izhikevich model, two topology of pipeline are chosen (Cassidy and Andreou, 2008). There are five stages of computing for each equation. The I(stat), I(exc), and I(inh) currents describe the synaptic contribution. (A2) Hw-based model. Comparison of f(I) curves between biological Regular Spiking (RS) neuron and digital one. The biological curves are intracellular recordings of regular-spiking neurons in ferret visual cortex in vitro. The neuromorphic board gives the same results in term of frequency of the neuron vs. the stimulation current. (B) Outputs of the detection system to be implemented in the closed-loop set-up of the brain prosthesis. First row—(a). Raw electrophysiological signal. Second row—(b). The same signal with added Gaussian white noise to reduce Signal to Noise Ratio. This step was added to stress the capability of the system to detect action potentials in difficult conditions. Third row—(c). Output of the stationary wavelet decomposition preprocessing module. We used a Haar mother wavelet with 16 bits fixed point computation. The output signal is the sixth level detail output of the decomposition tree. Fourth row—(d). Binary output of the detection module. This output is the result of a threshold applied to the signal in (c). The threshold is computed from the standard deviation of the first level detail output of the wavelet decomposition tree. The emphasized detected spike is a false positive. This shows that the signal (b) represents the limit of signals that can be reliably processed by our system. These signals were first recorded then input to the system with a waveform generator.

