FIGURE 2.


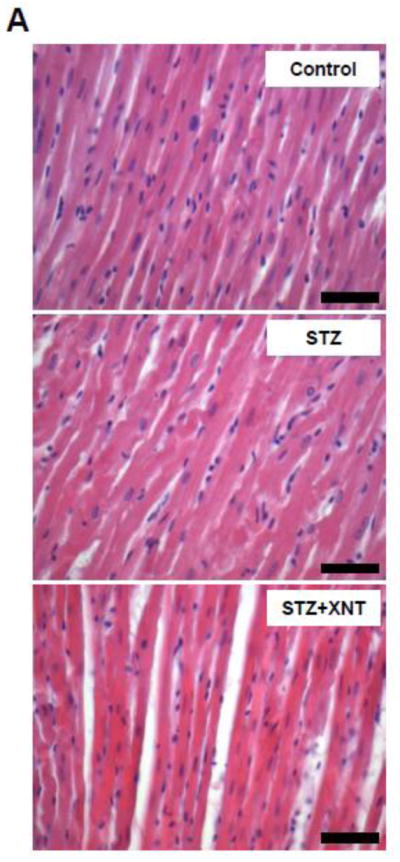
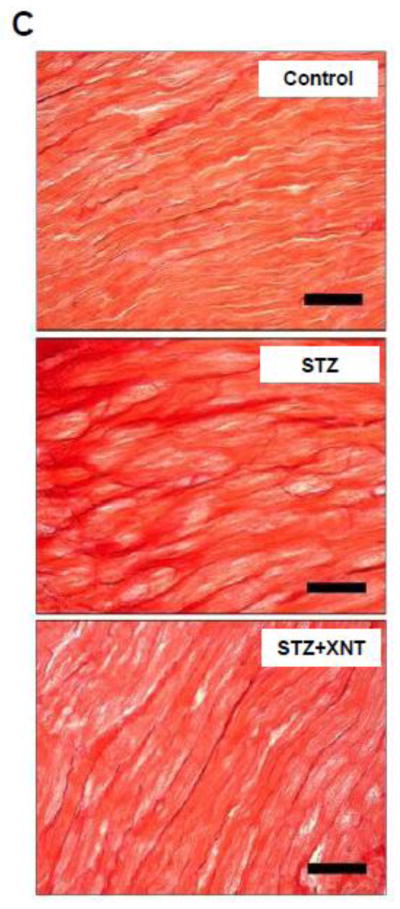
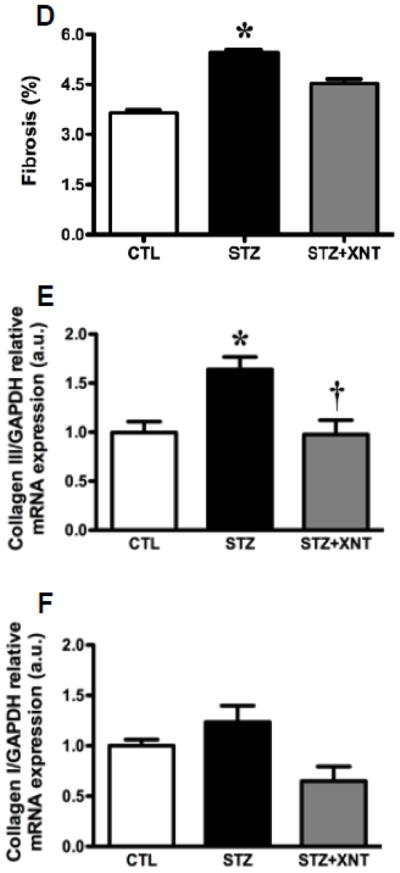
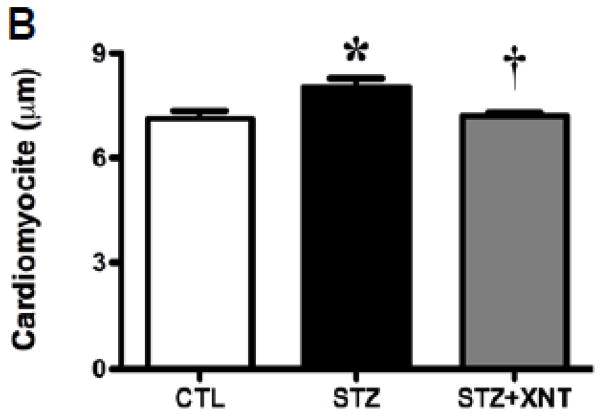
Effects of XNT on the cardiac remodeling induced by diabetes. (A) Representative photomicrographs of cardiomyocyte diameters of control animals, diabetic rats treated with saline (STZ) and diabetic animals treated with XNT (STZ+XNT). H&E (scale bar = 40 μm). (B) Cardiomyocyte diameter quantification (μm) (CTL: n=4; STZ: n=5; STZ+XNT: n=4). (C) Representative photomicrographs of left ventricular interstitial fibrosis of control animals, diabetic rats treated with saline (STZ) and diabetic animals treated with XNT (STZ+XNT). Intense red color indicates fibrosis. Picrosirius-Red staining (scale bar = 40 μm). (D) Quantification of the interstitial fibrosis (%) (CTL: n=3; STZ: n=3; STZ+XNT: n=4). mRNA expression of collagen type (E) III and (F) I in control animals, diabetic rats treated with saline (STZ) and diabetic animals treated with XNT (STZ+XNT). Collagen type III (n=4) and collagen type I (n=3). The data are shown as mean ± S.E.M. *P<0.05 vs. CTL and †P<0.05 vs. STZ. One-way ANOVA followed by the Newman-Keuls post test or Kruskal-Wallis analysis followed by the Dunn’s post test.

