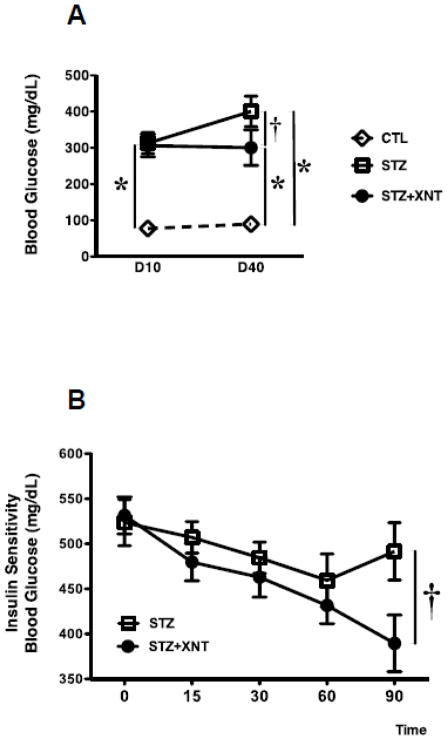
FIGURE 3.
Effects of diabetes and XNT treatment on glucose regulation. (A) Fasting blood glucose levels (mg/dL) after 10 and 40 days (D10 and D40, respectively) of diabetes induction. CLT (n=15, white diamond), STZ (n=11, white rectangle) and STZ+XNT (n=16, black circle). (B) Insulin sensitivity in control and diabetic rats treated or not with XNT (STZ: n=11; STZ+XNT: n=8). The data are shown as mean ± S.E.M. *P<0.05 vs. CLT and †P<0.05 vs. STZ. Two-way ANOVA followed by the Bonferroni post test.

