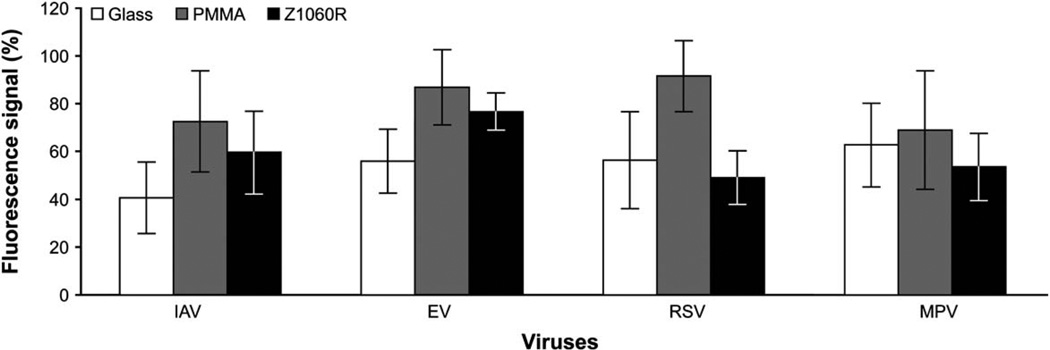
Fig. 6.
Comparison among glass, PMMA, and COC (Zeonor 1060R) for flow-through microarray hybridizations. Each fluorescence signal represents an average from 36 spots on 3 slides and it is expressed as a percentage of the signal obtained from the corresponding control. The fluorescence signals are from Cy3-labeled amplicons hybridized to DNA microarray. Adapted from ref. 71 with permission from American Society for Microbiology.

