
Figure 1.
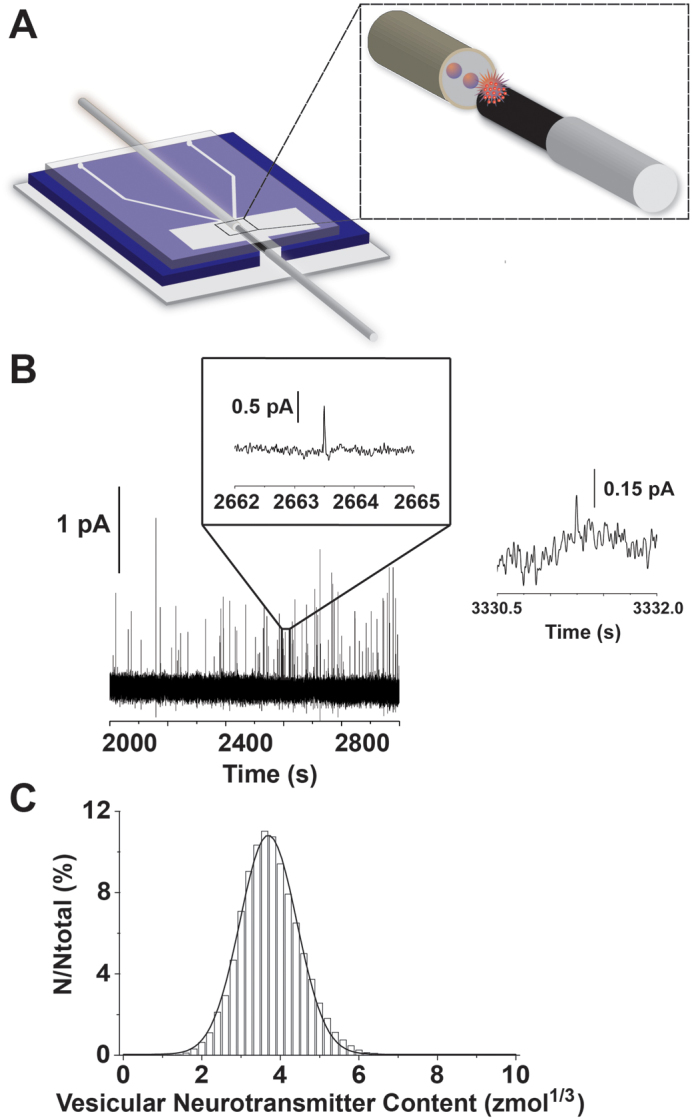
Electrochemical cytometry of mouse striatal vesicles (A) Schematic of electrochemical cytometry. Electrochemical cytometry uses capillary electrophoresis to separate individual neurotransmitter vesicles. The electrophoresis capillary terminates into a PDMS-based microfluidic device where individual vesicles undergo chemical lysis as they exit and strike the carbon-fiber detection electrode. The vesicle contents are quantitatively detected using amperometry. (B) Representative data from electrochemical cytometry analysis of mouse synaptic vesicles isolated from striatum. Presented is a 1000-s portion of an electropherogram showing lysis and subsequent electrochemical detection of total neurotransmitter content in synaptic vesicles. The inset depicts an expanded axis to view the typical peak characteristics. To the right is shown an event representative of the smallest vesicles quantified on the electrochemical cytometry device. The peak integral is equal to 0.58 fC (1,841 molecules, 3 zmol), and falls in line as one of the smaller vesicular neurotransmitter amounts quantified by amperometry. (C) Normalized frequency histogram for vesicular neurotransmitter amounts quantified from mouse striatal vesicles by electrochemical cytometry. Data are plotted as the cube root transform. Bin size = 0.2 zmol1/3. Fit was obtained from a Gaussian distribution of the data. Distribution mean is 3.7 zmol1/3. The correlation coefficient for a single Gaussian fit of these data is 0.99.