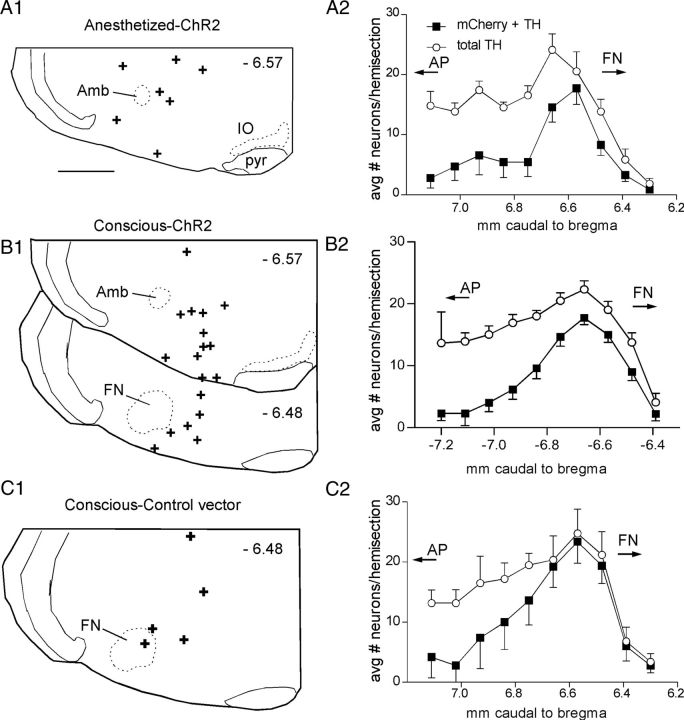
Figure 2.
Anatomical distribution of the ChR2-expressing CA neurons and the location of the fiber optic tip. A1–C1, Fiber optic tip placements for the experiments identified above the drawings. Approximate distance from bregma shown in each section (top right). Scale bar: (in A1) A1–C1, 0.5 mm. A2–C2, Grouped rostrocaudal distribution of the RVLM-CA neurons (filled square, neurons ir for both mCherry and TH; open circles, total TH-ir neurons). Cells counted on left (injection) side only. AP with the arrow indicates the rostral tip and caudal extent of the area postrema. FN with the arrow indicates the caudal most location and rostral extension of the facial motor nucleus. Amb, Compact formation of the nucleus ambiguus; IO, inferior olive; pyr, pyramidal tract.

